FOMO v Valuation Reality in the Casino
News
|
Posted 26/08/2020
|
8267
Few are looking at the current sharemarket and saying ‘that makes sense’. However that is not stopping people buying in at these levels purely on a thesis of momentum and central bank support. The herd is alive and well and playing the casino that is current markets somehow thinking the house has their back.
On Monday we wrote to Real Investment Advice’s Lance Roberts’ strongly held view that March was merely a correction and the real end to this bull market, the longest in history, is still at large. In speaking to that bullish herd he notes:
“Price measures the current “psychology” of the “herd” and is the clearest representation of the behavioural dynamics of the living organism we call “the market.””
So one shouldn’t underestimate the extent to which markets can get ‘irrationally exuberant’ before reality takes over. At such times FOMO can kick in and people pile in at the end. To contain that FOMO you need to look at the fundamentals of what you are buying in to. Buying shares should ultimately be based on the future value and returns of the company measured in any number of ways. Buying shares at this latter stage of the longest bull market in history should not be about seeking a yield in the absence of any other investment providing one, particularly when you are chasing a 4% yield against the potential of a 60% drop in your capital.
Roberts reminds us of the effects of monetary stimulus on ‘growth’ as measured by share prices and the cyclical trap it presents.
- “Using monetary policy to drag forward future consumption leaves a larger void in the future that must be continuously refilled.
- Monetary policy does not create self-sustaining economic growth and therefore requires ever-larger amounts of monetary policy to maintain the same level of activity.
- The filling of the “gap” between fundamentals and reality leads to consumer contraction and, ultimately, a recession as economic activity recedes.
- Job losses rise, wealth effect diminishes, and real wealth is destroyed.
- The middle class shrinks further.
- Central banks act to provide more liquidity to offset recessionary drag and restart economic growth by dragging forward future consumption.
- Wash, Rinse, Repeat
If you don’t believe me, here is the evidence.
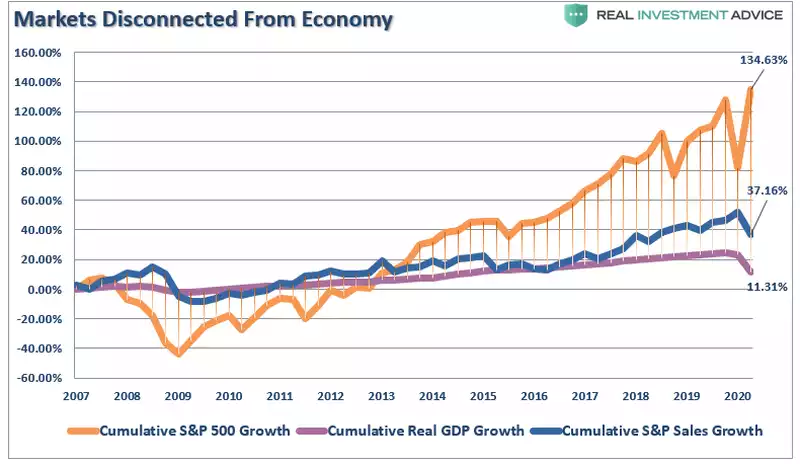
The stock market has returned more than 130% since 2007 peak, which is more than 12x the growth in corporate sales and 3.6x more than GDP.”
He then goes on to share a few different valuation methods to show where we are right now.
Firstly Tobin’s Q-Ratio which measures the market value of a company’s assets divided by its replacement costs. The higher the ratio, the lower the future returns. The graph below adds in the better known Shiller CAPE-10 ratio, highlighting the strong correlation between the two and the historically proven outcome of low 10 year returns from such heady highs as we currently find ourselves:
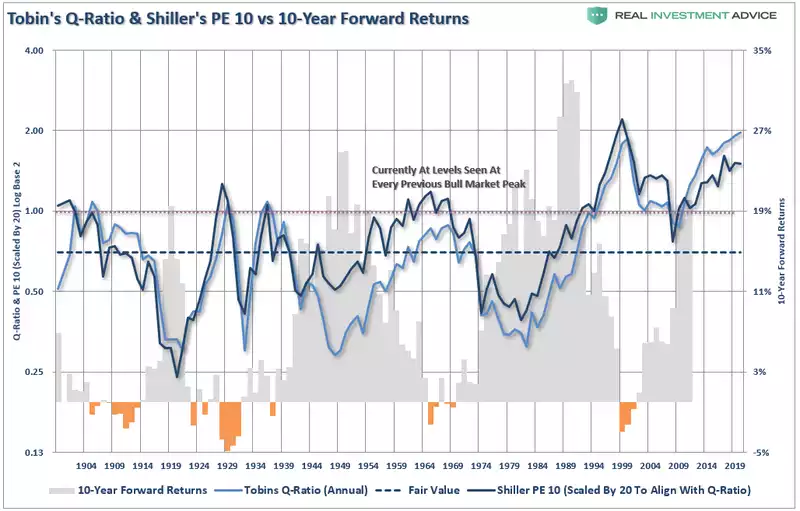
Removing the ‘this time is different’ because rates are so low and promise to be for some time, he adjusts the Shiller CAPE-10 accordingly…
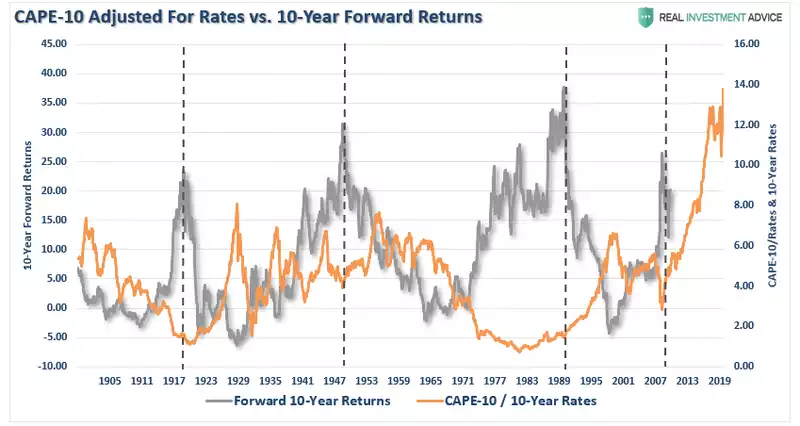
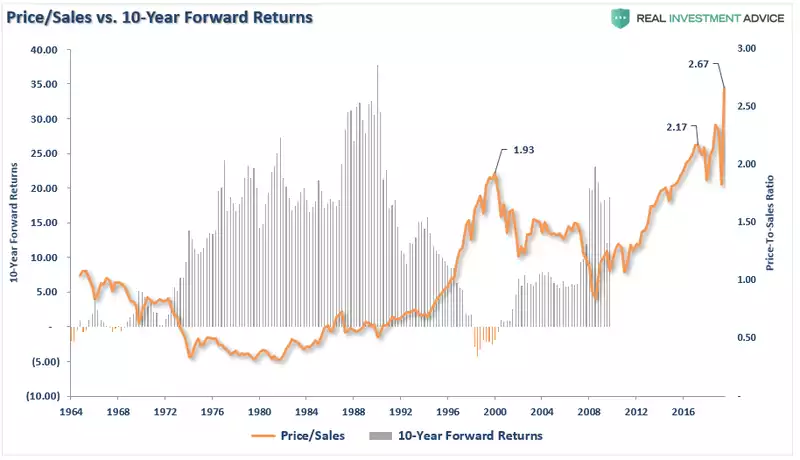
But, but, sales are so strong… Nope. Measured against sales, valuations are pushing their highest level in history:
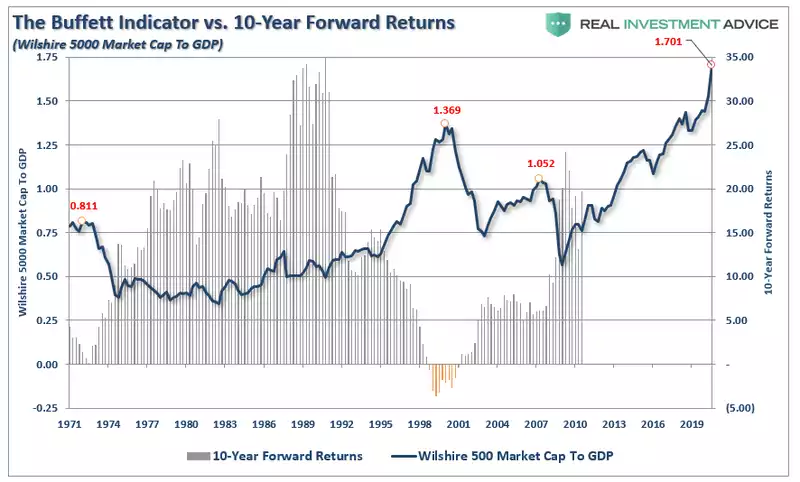
Warren Buffet, who last quarter made a big move into gold and out of financials, has a favourite measure of value, being market cap divided by GDP. Again, pushing record highs…
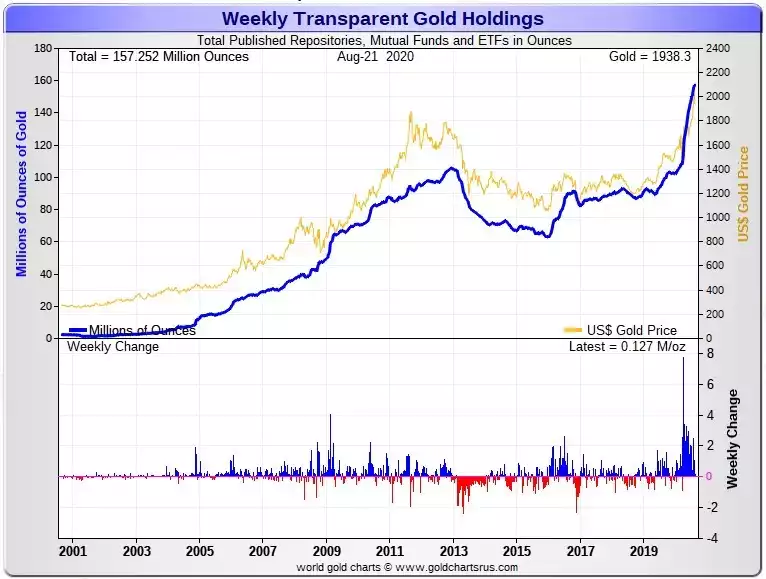
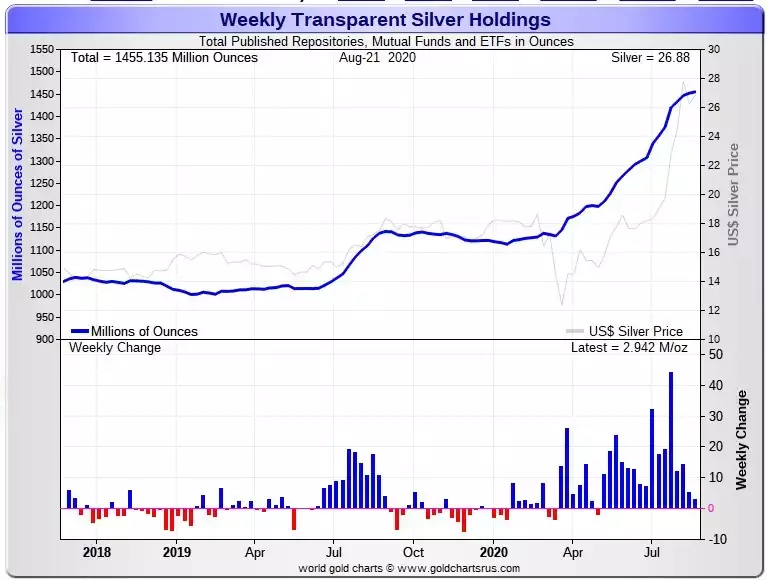
Big money, smart money, is still piling into gold and silver as seen in the charts below. This may be a hedge whilst still playing this rigged casino or they may just be handing it over to the hapless retail investors to again come in at the end. Only time will tell, but history says this doesn’t end well. And for the mums and dads just looking for that 4-5% yield. They are yet again forgetting the math that says after a 60% drop (as discussed Monday) you need to make 150% to get back to even…
