2016 Gold & Silver Investment – Real v Paper
News
|
Posted 19/05/2017
|
6482
Some lament the influence paper (futures) trades in gold and silver have on the ‘natural’ price, and some are thankful for the apparent buying opportunity of physical metal it currently affords.
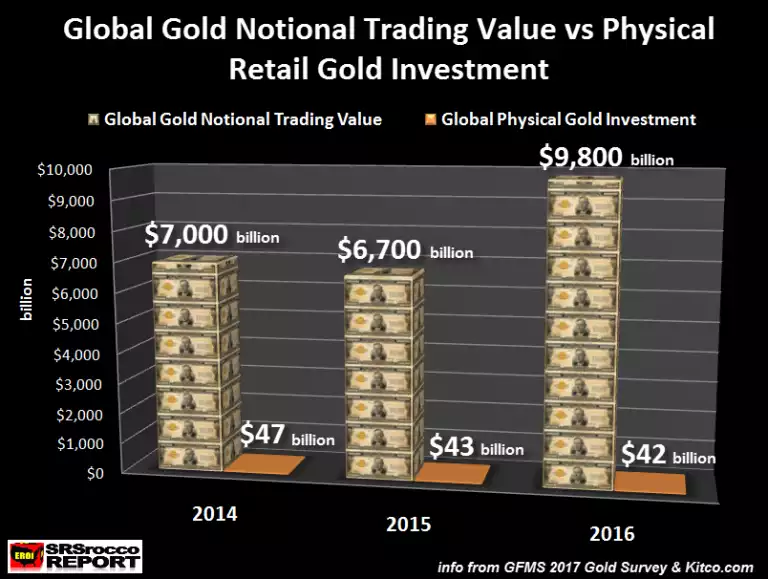
Today we put the sheer scale of these paper trades into context. Firstly gold. 2016 saw an incredible, and all time record, $9.8 trillion (243,000 tonne!) of gold traded in the top 9 exchanges in the world (dominated by COMEX with 179,047t). That was 46% more than the total in 2015. By comparison (using the same average gold value) there was only $42b traded in physical investment (bars, coins and ETFs) gold. That is a 233:1 ratio! For further context, that 243,000 tonne was 76 times global mine supply!
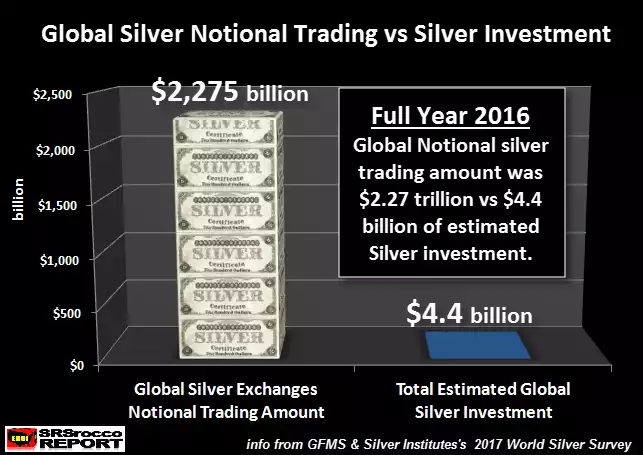
So you think 233:1 is amazing? Well, let’s talk about silver….
In 2016 we saw $2.72 trillion (4.9m tonne) of silver traded in the top 9 exchanges in the world. By comparison just $4.4 billion (7,900 tonne) was traded in physical investment (bars, coins and ETFs) silver. That is a ratio of 620:1 and represents 180 times global mine supply! (the chart below shows $2.27t but we think their calcs are wrong. 159b oz at an average of $17.14/oz = $2.72t not $2.27t) .
We wrote Monday about the epic set up in COMEX at the moment. As we lead above, whilst the apparent downward ‘manipulation’ or price suppression suspected through these futures exchanges is a frustration for many, hindsight may one day show that it was a gift of a lifetime. At some stage, likely when you most need it, the physical market will prevail. In the meantime, enjoy it while it lasts as the above ratios simply can’t ….