Yield Curve Control – How the Fed’s Next Tool Works
News
|
Posted 10/06/2020
|
25061
Tonight the Fed meet for the monthly FOMC meeting. As has been a recent trend, gold has dipped beforehand and last night started to rally, up nearly 1% in USD terms and 1.9% in AUD. So what are we expecting from this omnipotent entity as US sharemarkets regain all time highs (before falling at the end of trade last night), the USD falling for 9 straights days (its longest decline since 2016), and US Treasury yields climbing (again before declining since Friday).
For the Fed rates are already at zero and they will staunchly resist negative rates until they have to capitulate. They have been quietly winding back their QE to ‘just’ $4 billion per day from the initial ‘emergency’ $75 billion however the Pavlovian bell still sounds and thus shares still ‘to da moon’. But with their own Atlanta Fed’s GDPNow estimate for this quarter now at minus 53%, the worst print in all history, the problem is far from fixed.
Last meeting Fed chair Powell hinted at their employing so called Yield Curve Control (YCC) as the next tool in the belt. YCC sees the Fed target controlling longer term yields by buying (or selling) as many long term bonds as necessary to achieve the target yield. As we’ve explained before, yields are normally higher for longer term bonds (say 10 or 30 year) than shorter terms of say 2 years on the logical basis of the risk of return over a longer period. Banks use this to make money by selling you debt at that higher rate than that they buy at the lower rate and pocketing the difference. That all becomes a little challenging for banks when the yield curve (the mapping of those short to long term yields) flattens.
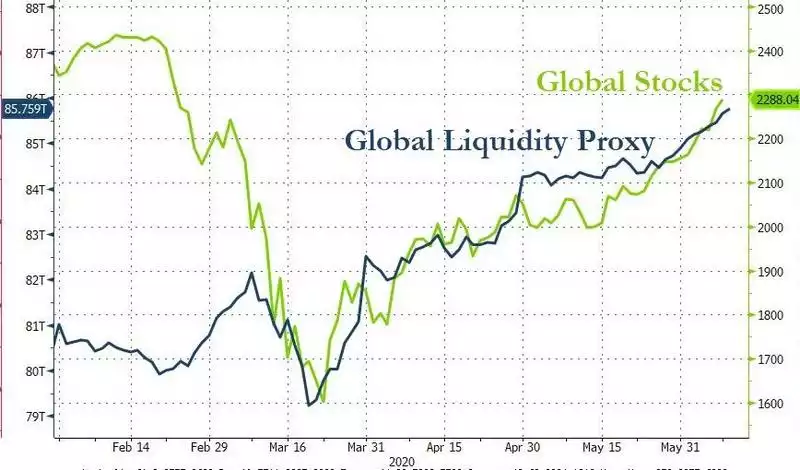
However the Fed is incentivised to keep longer term yields as low as possible to encourage more borrowing at low rates for public, corporate and household debt for things like houses and cars to keep the economy going. It’s also a means to try and encourage their beloved inflation to reduce their debt burden, however regular readers will know that UBS’s chief economist cast large doubt over that thesis recently here. Finally, it should also encourage even more into shares and reduce demand (and hence price) for the USD. The chart below again reinforces the nexus that has formed between all this newly created liquidity (worldwide, not just the US) and share prices:

YCC has not been used in the US since it was implemented for several years after 1942 when they had to deal with the massive WWII funding debt. More recently the Bank of Japan has used YCC since late 2016 to keep their 10 year JGB yield to zero.
Whilst it sounds similar to QE, it is much more targeted and in theory achieves interest rate objectives at far less cost than QE which buys everything but particularly short term.
The risks of course should be obvious in that it will encourage even more borrowing from an already over extended system both public and private whilst punishing savers and pensioners.
Saxo Bank’s Head of Equity Strategy, Peter Garnry wrote this yesterday:
“Yield-curve control has mixed results when it comes to equities. Japan's YCC policy since September 2016 has not been a success judging from real GDP growth and for Japanese equities which have underperformed global equities. The period 1942-1951 when the Fed had a YCC policy in place suggests a more positive picture for equities against inflation hinting that YCC can work as a crisis tool. However, the key risk related to YCC is inflation risk as our study of inflation and equity returns suggest inflation growth of 4% or higher leads to bad real rate returns for equities.”
And
“YCC combined with aggressive US government deficits could suddenly create inflation which history suggests has a tendency to be a wild beast when it escapes its normal ring-fencing. Higher inflationary pressures will not immediately become negative for equities as our analysis from May 2019 of equities and inflation over 105 years suggest. A mild positive inflation shock has historically been associated with positive real returns in equities. It’s actually a large deflationary shock that has been associated with negative real returns. Equities have historically delivered negative real return when inflation has sustained its growth rate above 4%. This is the real danger for equities.
How likely is it that the Fed will introduce YCC? The Fed introduced YCC in March 1942 to stabilize the bond market amid rising inflation expectations due to enormous US war deficits. This time around deflationary forces seem to be more dominant than inflationary forces due to the demand destruction from COVID-19 lockdowns around the world. Fixing the long-term yields will mostly lead to lower monthly purchases of bonds and thus lower growth of the Fed’s balance sheet while sending a signal to the Treasury to stimulate the economy through government deficits without worrying about stability in the bond market. YCC will most likely come and already this year as it’s naturally crisis tool but also an important tool to create inflation and thus dig the world out of its debt mountain. But whether it will be announced tomorrow at the FOMC meeting is more uncertain. Given the current market pricing it’s most likely that the Fed will keep this tool in the box and utilize it if the market destabilizes over the coming months.”
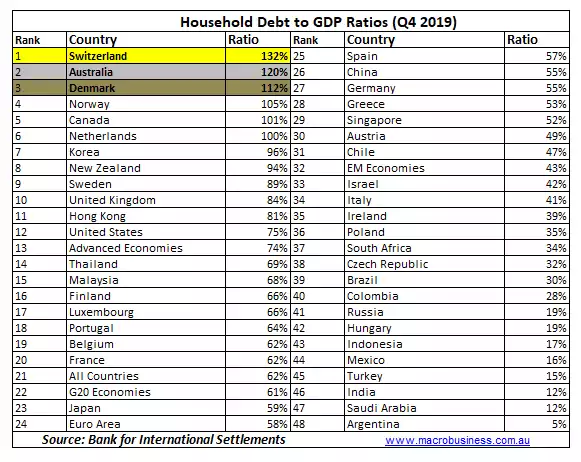
Australia’s RBA has employed YCC since mid March amid the market chaos, targeting 3 year bond yields at just 0.25% and it appears to be working in keeping borrowing costs low and encouraging more debt. It did little to stop the sharemarket carnage which continued on for nearly 2 weeks afterwards but has since been recovering in this central bank + hope rally seen around the world. But it is good to see Australians embracing more and more debt and retaining the silver medal for highest household debt in the world behind Switzerland according to the latest report from the Bank for International Settlements (BIS). With property prices easing and some still calling for sharp falls, what could possibly go wrong….
