What Happens After the Trade Rout?
News
|
Posted 20/05/2019
|
7717
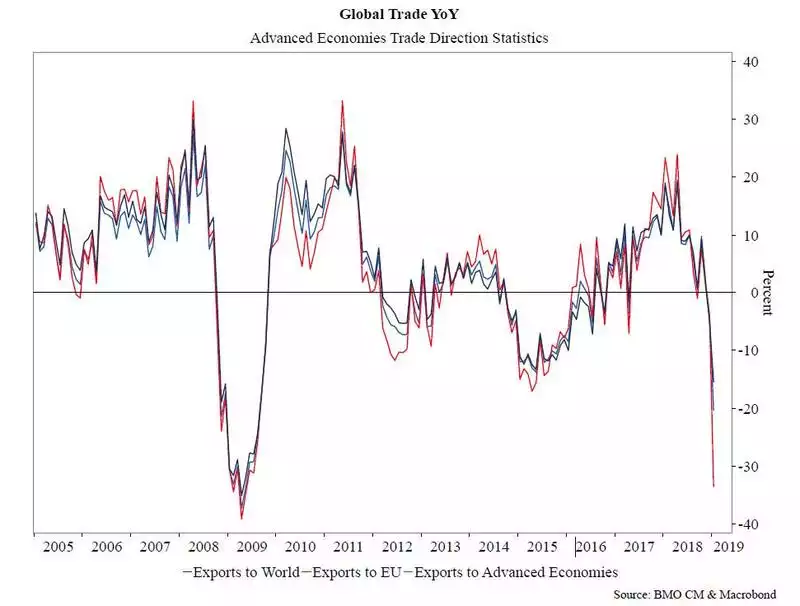
On Friday we shared a chart from the IMF showing a plummet in global trade of a magnitude not seen since the GFC. If you missed it you can read the full article here or below is that chart.

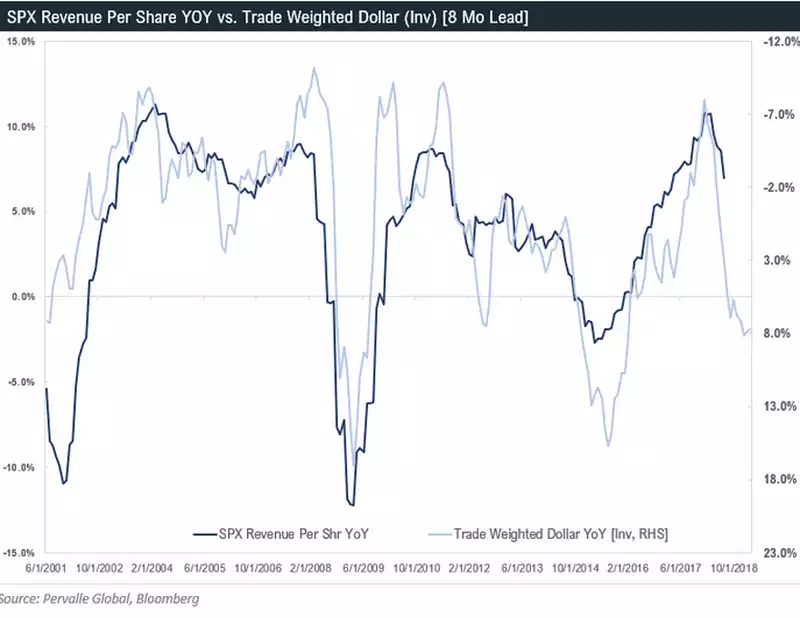
In the US, around 50% of corporate earnings come from international activity. In that context, charts like that above take on significant importance to the earnings of the world’s biggest share index, the S&P500.

It’s hard to see how shares will buck this historic correlation and ‘ignore’ the global trade rout. It’s also way too simplistic to just blame the US – China trade war and think all will be fixed if they come to an agreement. Global trade was trending down well before Trump and Xi locked horns.
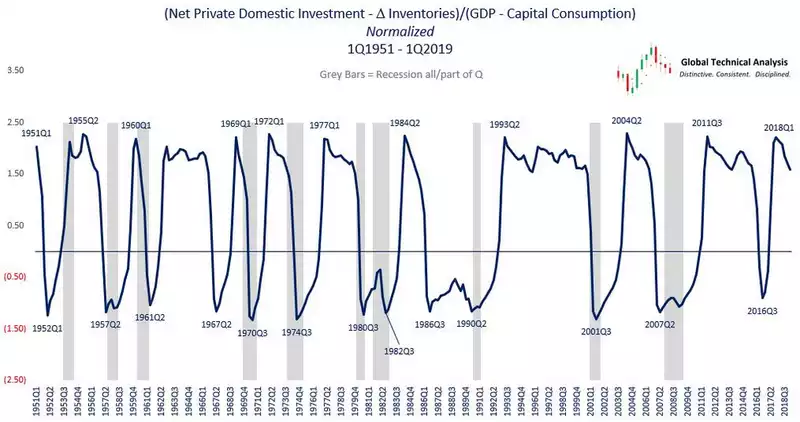
With declining revenue you can expect declining capital expenditure impetus. The chart below shows very clearly that, apart from the 60’s and 2015/16, each instance of falling capex against GDP (capital consumption) has coincided with or preceded a recession. That last exception was most likely due to the Trump tax cuts incentivising spending (now washed out) and a then belief that he would indeed make everything great again. Nope.

So here we are again at the beginning of the turn in capex amid a global downturn in trade, having spent increasing amounts on corporate buybacks, and dragging a bigger and bigger debt burden along. What happens next?