Gold Price : Monetary Base Ratio – Bull Market Signal
News
|
Posted 04/08/2016
|
10240
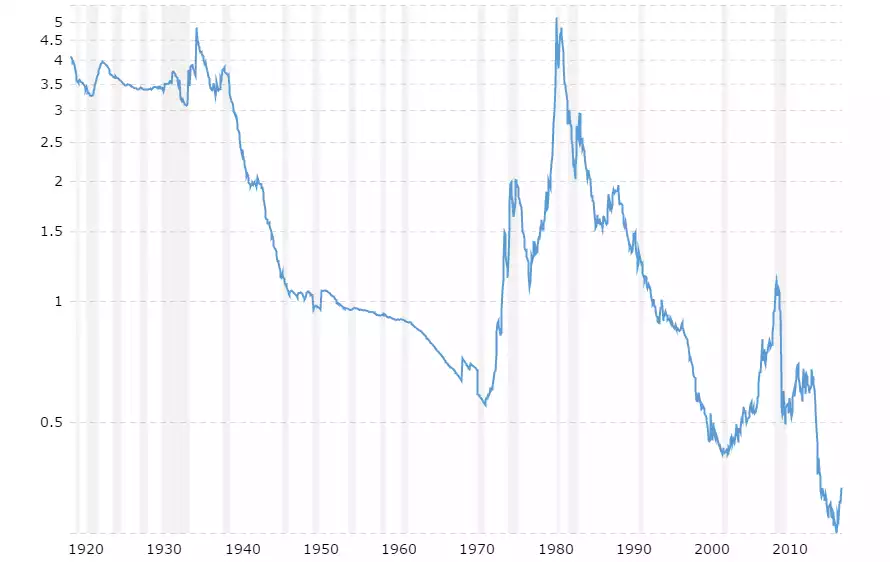
Yesterday we showed you the mammoth scale of monetary expansion in both the US and Japan, where Japan has exceeded even the previously unprecedented efforts of the US. Whilst it is harder to get ‘real numbers’ it appears China has easily exceeded both as well. With the ECB now joining the party with gusto, it is a world awash with new money. Recall the Global Central Bank Balance Sheet graph we showed you last week here. So how does all this new money track against gold? We haven’t found a global one, but the following graph (from macrotrends.net) shows the ratio of the price of gold to the US monetary base (the world’s reserve currency) from 1918, and it is one to take special note of.
Last time we shared this chart ($20,000 Gold v Monetary Base) the ratio was carving out a new all-time low, i.e. gold had never been cheaper against the supply of money. As you can observe now, that ratio is strongly and consistently on the up as was the case before each of the bull markets before it. But this time it is starting from a much more undervalued base….
This trend see’s gold restate its position as the protector of wealth when currency ‘money’ is being debased either through inflation or rampant printing. It has a lot of catching up to do and a purchase now could see you enjoy that ride…