Gold Jumps on Record PPI, Record Negative Real Rates, “significant declines” Fed warning
News
|
Posted 10/11/2021
|
9803
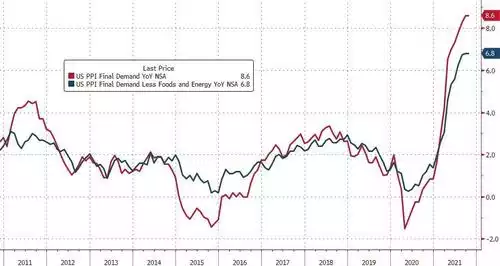
Last night saw the US Producer Price Index (PPI) hit an all time high of 8.6% in another blow to the ‘transitory’ inflation narrative. PPI measures inflation at the factory door. If its not passed on to the consumer the manufacturer sees margins squeezed and hence earnings are hit. If it is passed on then CPI goes up. It’s a no win situation in a tepid economy and again raises the specter of stagflation.

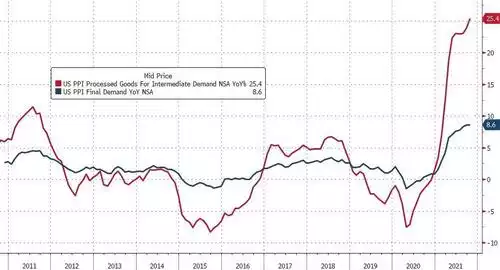
Going one step further down the supply chain and it gets even scarier:

The growing concern of a Fed ‘policy error’ is being reflected in the bond market and increasingly in gold as well. Gold rallied strongly last night, now sitting over US$1830/oz. The AUD is dropping too seeing even greater gains in AUD priced gold now over $2480/oz. Bonds rallied strongly too and the curve is flattening with the gap between 2-year and 30-year Treasury yields the smallest since the end of 2020. This is signaling the market expects things to turn for the worse in the longer term, i.e. the ‘policy error’ of the Fed not moving quicker to get a hold of inflation.
This wasn’t helped as news broke of Biden interviewing know ‘uber dove’ Fed Governor Lael Brainard to possibly replace Jerome Powell as Fed chair. The Fed also released their twice-yearly Financial Stability Report, warning:
“Asset prices remain vulnerable to significant declines should investor risk sentiment deteriorate, progress on containing the virus disappoint, or the economic recovery stall”
US shares fell last night as the market digests the meaning of all of this, clearly seeing that money flow into bonds and gold.
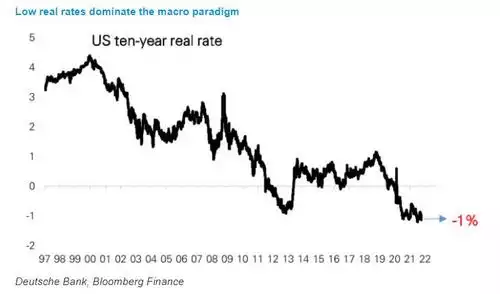
The combination of falling bond yields and strong inflation is also seeing a new record, and that is real yields are more negative than ever before. Remember REAL yields are bond yields less inflation. Low interest rates (because of a fundamentally weak economy) and high inflation mean negative real rates:

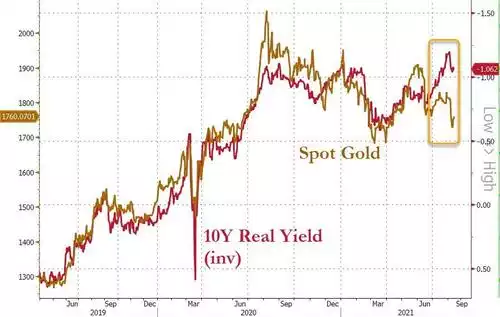
The real yield chart shares a couple of correlations. First, we have shared many times the very tight correlation between the gold price and the inverted real yield chart. i.e. as real rates go negative the gold price goes up. HOWEVER, in recent months we have witnessed a very unusual dislocation where the gold price was lagging. We posted the chart below just a couple of months ago:

As you will note gold looks to at last be starting to catch up to the historic correlation after months of lagging.
The other correlation is that with growth shares like those on the NASDAQ or small cap Russell 2000 where lower real yields have meant lower share prices. You can see below that too has been lagging and may portend the “significant declines” the Fed is warning of.
What is abundantly clear, again, is we are witnessing unprecedented distortions and excesses in markets borne of too much monetary stimulus, too much debt, and a system more broken by COVID then seems to be appreciated lately.
Common sense must ultimately return and we may well be witnessing that starting now with investors turning to gold as the ultimate protection against, and indeed benefactor of, the inevitable outcome of these excesses.