Strong v Weak Hands – Bullish Setup for Precious Metals
News
|
Posted 16/08/2021
|
10517
Both gold and silver enjoyed very strong sessions Friday night our time up 1.5% and 2.5% respectively. A large driver of this move was one of the worst consumer sentiment prints in the US in history. From CNBC:
“A key consumer sentiment reading saw a dramatic drop in early August as the delta variant of Covid-19 increased fears about the path of the economy, the University of Michigan said Friday.
The consumer sentiment index tumbled to 70.2 in its preliminary August reading. That is down more than 13% from July’s result of 81.2 and below the April 2020 mark of 71.8 that was lowest of the pandemic era.
It was the lowest reading for the measure since 2011. Economists surveyed by Dow Jones were expecting a reading of 81.3 for August.
And a sudden drop of that magnitude is extremely rare for the index.
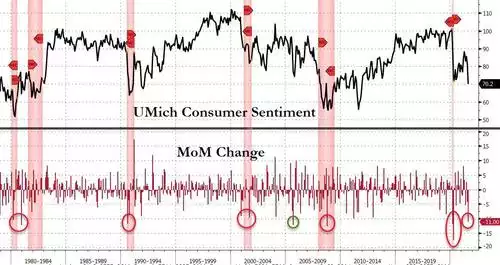
“Over the past half century, the Sentiment Index has only recorded larger losses in six other surveys, all connected to sudden negative changes in the economy,” Richard Curtin, chief economist for the University of Michigan’s Surveys of Consumers, said in a release. Two of those larger month-over-month movers were April 2020 amid the pandemic and October 2008, during the financial crisis.”
The following chart maps that out clearly:
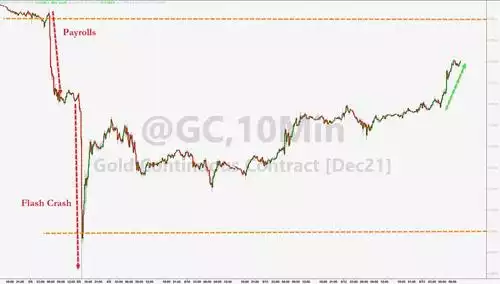
So strong was gold’s rally that it climbed back above the start of that Sunday night flash crash (we discussed here) and part of the NFP employment fall as well.
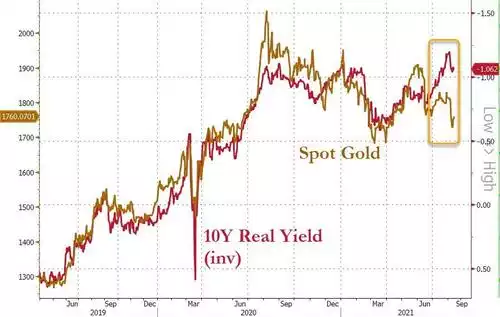
That said (from the chart below) the gold price is still lagging the historical correlation with real yields measured against the 10 year US Treasuries and so appears to have plenty of upside left to catch up.
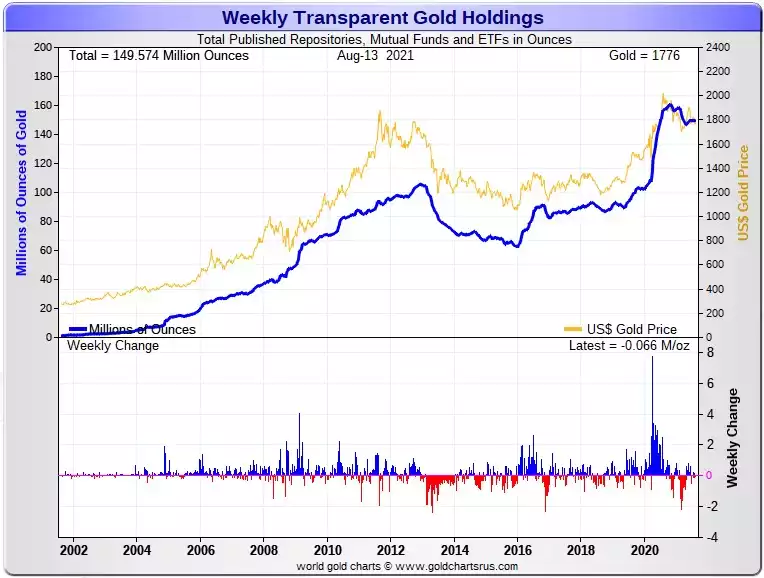
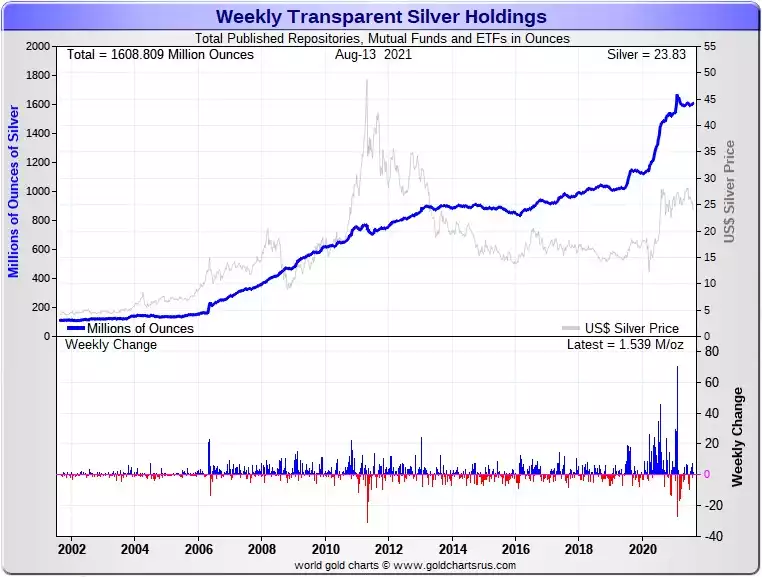
As we wrote in that linked article on the flash crash last week, that fall in the gold price appeared to all happen on the COMEX paper futures market, not in the ‘real world’. On Saturday we got confirmation of that when we saw the weekly update of all the physical gold and silver holdings in the various reporting entities around the world. On such a plunge in price one might expect to see huge outflows from depositories…. Nope. Gold holdings fell just 66,000 oz (try and spot the little red bar on the chart below) and silver, which fell more than gold in percentage terms, actually went up 1,539,000 oz!
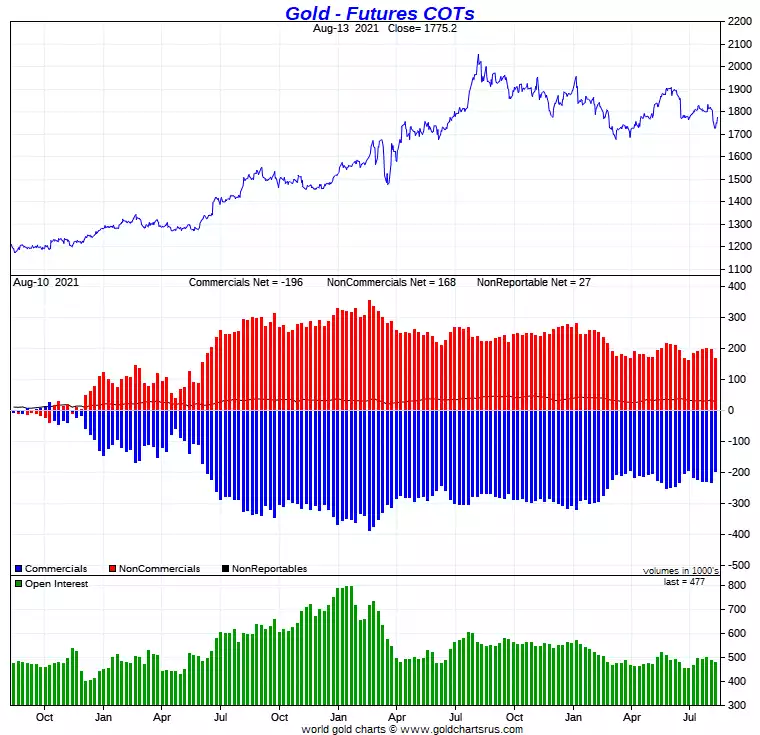
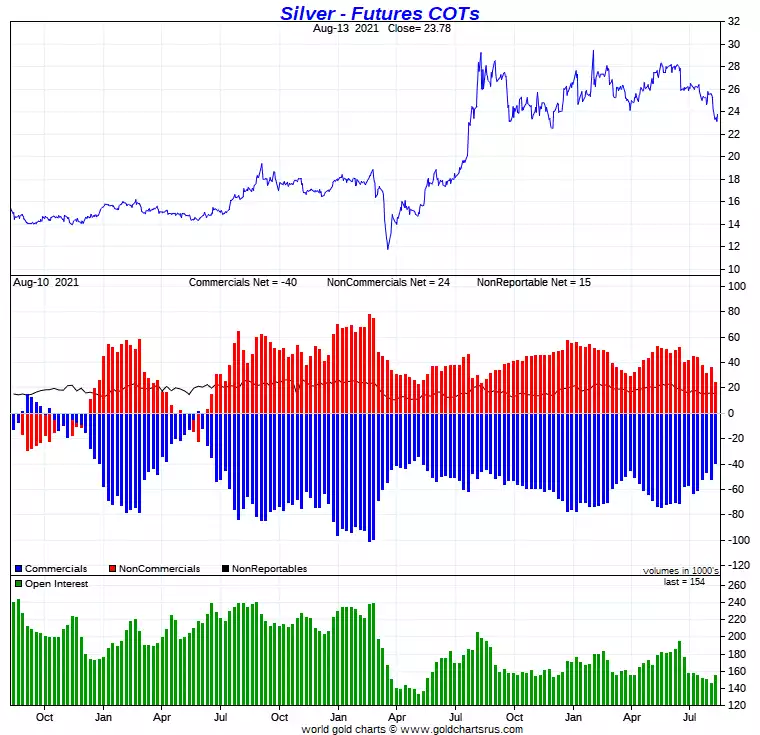
Looking at the culprit, the COMEX futures market, saw the Commercial traders, the group including the very bullion banks convicted of ‘spoofing’, unsurprisingly reduced their net short position in gold by 3.56m oz and in silver by an eye watering 61.6m oz, a thousand times more than the net move in depositories above. The charts below tell the story. And so yes, maybe they held big short positions, spoofed the market down by selling massive volumes into an illiquid market and then closed those positions at a nice profit… but look at the near 100% track record of prices rising strongly after dips in net shorts like now (particularly pronounced in silver). Remember too, bullion banks will almost always have some net short position as they facilitate all the hedging of miners. You are looking for a dip not a zero short.
If you can’t beat ‘em, maybe join ‘em….
And so what is the takeaway? The smart money is buying gold and silver. The strong hands holding the real stuff are keeping hold of it with both hands. The bullion banks, having seemingly given it a kick down to make some profit then moved toward the long side as the last 2 charts above show a near 100% track record of making profit from.