Early Days for Precious Metals
News
|
Posted 28/05/2021
|
11075
Yesterday we shared an excellent report from Crescat Capital about the economic setup in the US particularly around the impacts leading to inflationary pressures and what that means. Topically, overnight we learned that Biden is proposing federal government spending to jump to $6 trillion next year, the highest since WWII. Today we share Crescat’s conclusion as it relates to bullion.
“Early Days for Precious Metals"
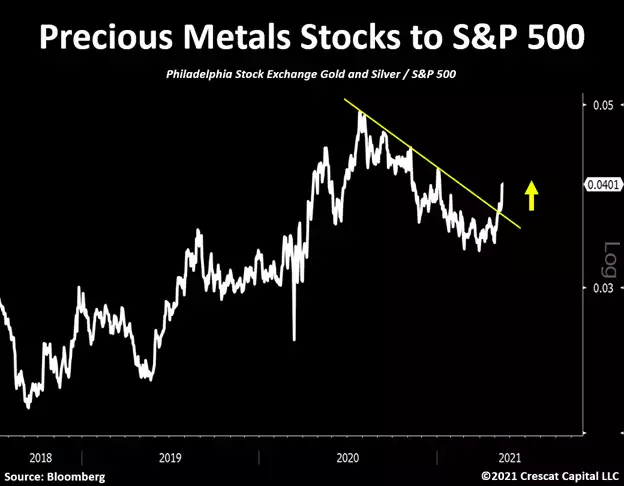
We believe overall equities will continue to underperform commodities, especially monetary metals. The Philadelphia Gold & Silver Index to S&P 500 ratio is now breaking out from an important resistance and it looks to be resuming an upward trend initiated in the fourth quarter of 2018. As long-term investors, we appreciate how much value can be unlocked in the gold and silver mining industry while also offering an incredible growth opportunity.
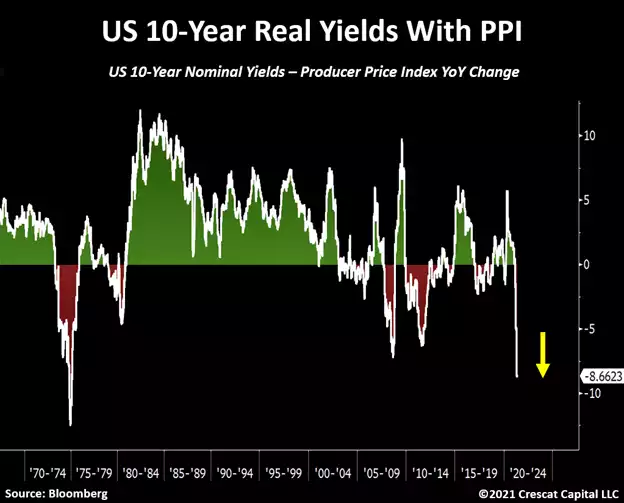
One of the key macro drivers for precious metals continues to be the fact that nominal rates are currently well below the levels of inflation. On the latest report for Producer Price Index (PPI), the number came out with a decade-high growth of 9.5% on a year-over-year basis. When you subtract 10-year yields to the PPI data, the number is close to -8.6% today. The spread is at its lowest level since the mid-70s.
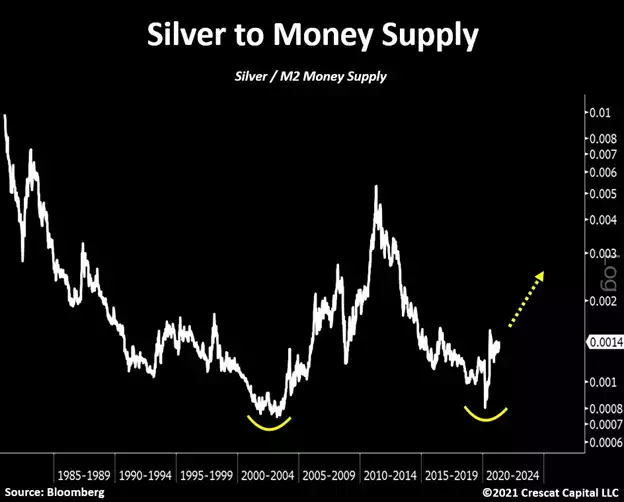
Silver is the single most important asset that we, as a firm, are focused on. If we had to boil down our entire macro thesis into one position, it would undoubtedly be that. Once silver breaks above $30, we believe we will see an explosive move to new highs. See below the almost perfect double bottom on silver to M2 money supply ratio.
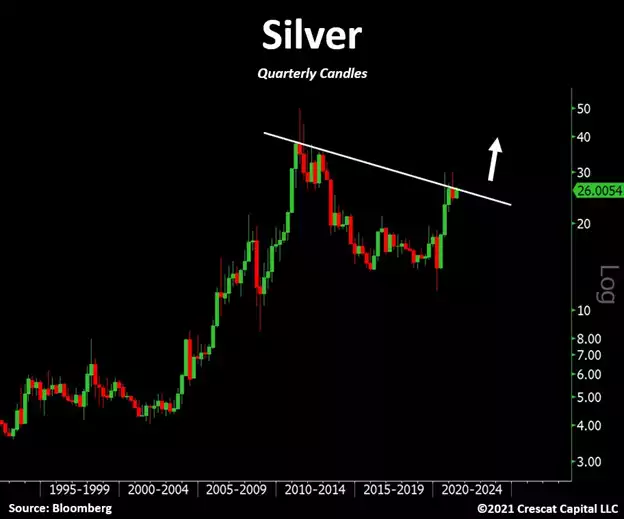
On a quarterly chart, it is truly astonishing to see silver hanging around such a historic resistance while sentiment remains mostly bearish. We believe the metal looks poised to another explosive move to the upside.
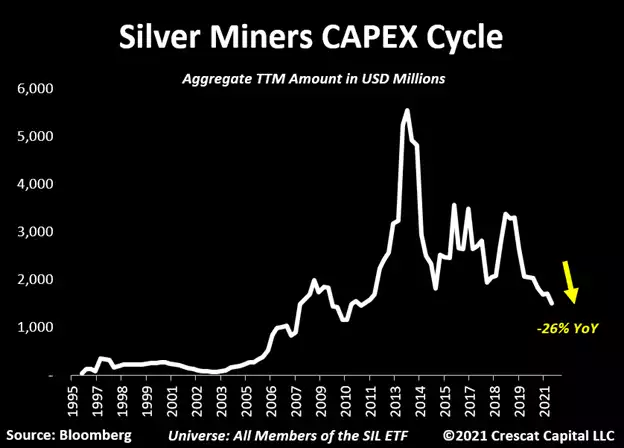
While the demand side of the precious metals thesis is incredibly compelling, the supply side is probably even more. The aggregate capex for the largest silver miners today just declined again reaching a new decade low. On a year-over-year basis, capital spending is down 26%.
Scarce Commodities and Scarce Labor
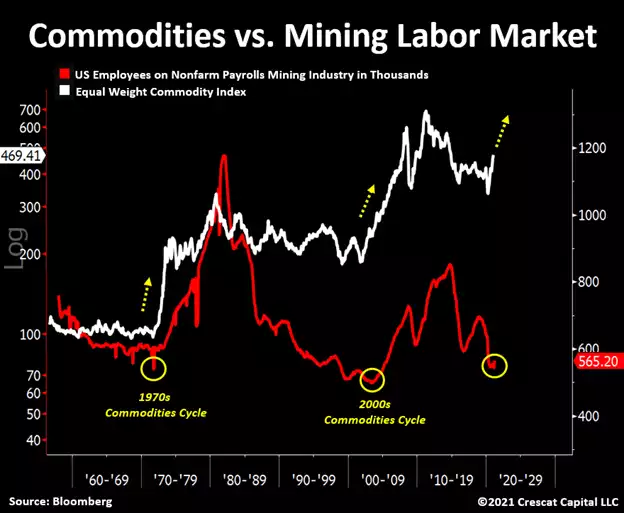
Here is a classic early sign of a commodity cycle. The mining industry nonfarm payrolls is now near historical lows. This happened in early 1970s and 2000s, both marking the onset of a commodities bull market. The labor and capital constraints are the amplifiers of a bull market in resource stocks.
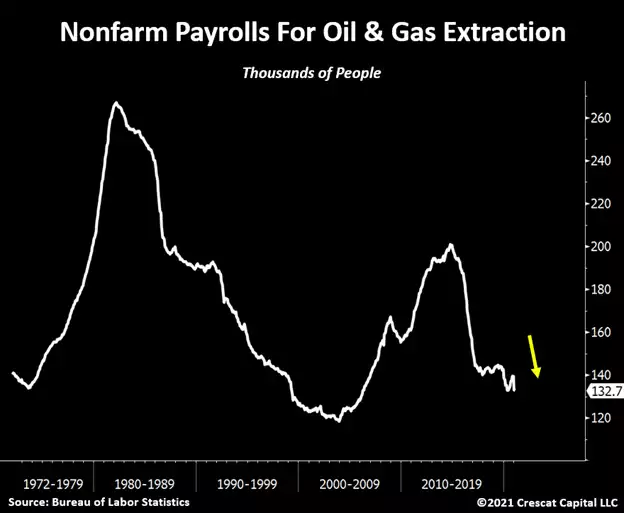
Obviously, all commodities are not mining job related, but see below the nonfarm payrolls for the oil and gas extraction industry which is also at historical lows. The new green political agenda has hardly even started yet.
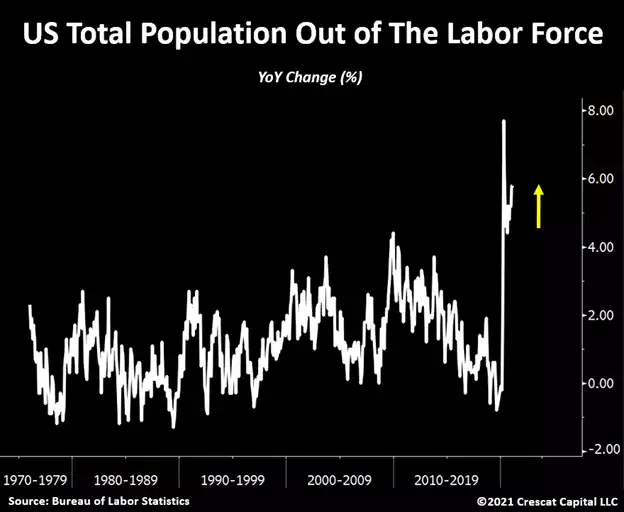
This pandemic has truly magnified a long-term trend of labor reduction and under investments in the commodities space. Resource companies have been facing a deep recession for some time now with not enough workers willing to enter this industry. On top of that, government policies seem to be discouraging folks from return to the labor market. In fact, as shown in the chart below, people continue to leave the labor force like never before.
On a recent interview, Minneapolis Fed president Neel Kashkari made the following statement after the latest jobs report disappointment:
“For all those people who have been saying ‘oh my gosh, the Fed needs to normalize quantitative easing,’ today’s job report is just an example of – we have a long way to go”
And then, subsequently said:
“We hear all the same anecdotes…yes of course there are people who are on the sidelines and who are getting generous unemployment and they’re saying ‘yes we understand the labor market will be strong in three or four months…we know that dynamic is there,”
It is funny how he expresses his concerns about the labor market to justify the current policies to then admit that the same policies (fiscal spending mostly funded through Fed stimulus) are also playing a major role in discouraging folks to return to the job market. Their own answer to the problem is what is worsening the recovery process.
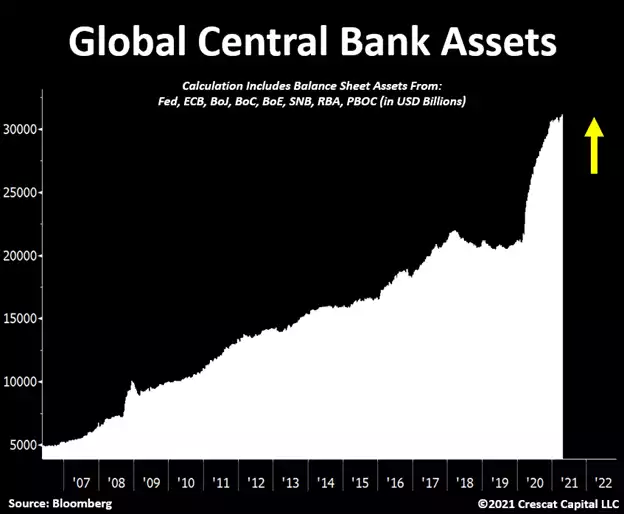
Global Fiat Debasement
Central banks are ultra-easy across the globe, and it seems to have no end in sight. See below that global central bank assets just reached $31T for the first time.
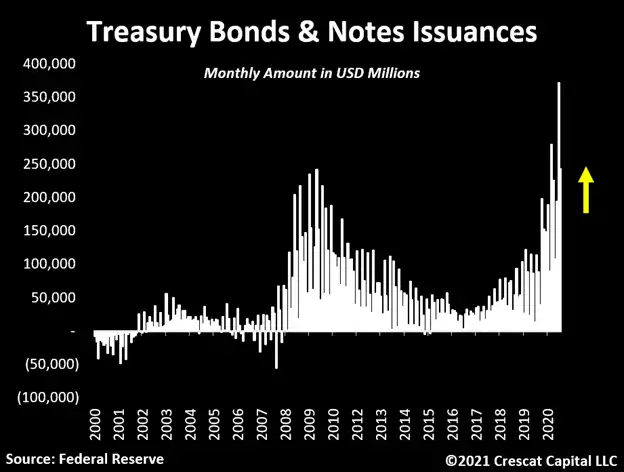
Treasury Market Dependence on the Fed
The recent increase in Treasury issuances is in perfect alignment with the market dependence on the Fed to continue monetizing debt through large quantitative easing programs. To note, in the last two months alone, the US government issued $614 billion worth of notes and bonds and the central bank only bought 26% of the total. To put that into perspective, that amount represents the lowest 2-month purchase relative to the issuance size in one year. Since foreign investors also did not participate at the same historical level we have seen in the past decades, the excess supply added tremendously to the upward pressure in yields in the last months and created severe headwinds to high-multiple stocks.”
And so in a world of excess supply of fiat currency, the contrast to the tightening supply of hard monetary assets such as gold and silver is so incredibly stark that more and more investors are starting to understand what comes next. Whilst debate continues over whether this inflation is ‘transitory’ or not, we potentially remain, as Crescat says above, in the very early days of this precious metals rally. For context, gold and silver as an investment remain below 1% of assets held globally. If that merely doubles to 2%, still an incredibly low number, you have just doubled demand for something that has extremely limited capacity (and arguably diminishing) to expand. In the Economics 101 equation of supply, demand and price that leaves but one variable…. Price.