Countdown to Recession
News
|
Posted 15/08/2019
|
19669
There were more heavy falls on Wall St last night and strong gains in gold and silver as the all important 2-10yr yield curve for US Treasuries inverted, China called trumps bluff on the tariff delay that buoyed markets earlier in the week, and more poor economic data confirmed China has serious wobbles. To top it off negative yielding debt reached a staggering $16 trillion and the Fed’s Bullard conceded the Fed should have gone negative and likely will.
As you can see from the chart below the inversion of the 2-10yr yield curve (previously explained here) has almost always preceded a recession.
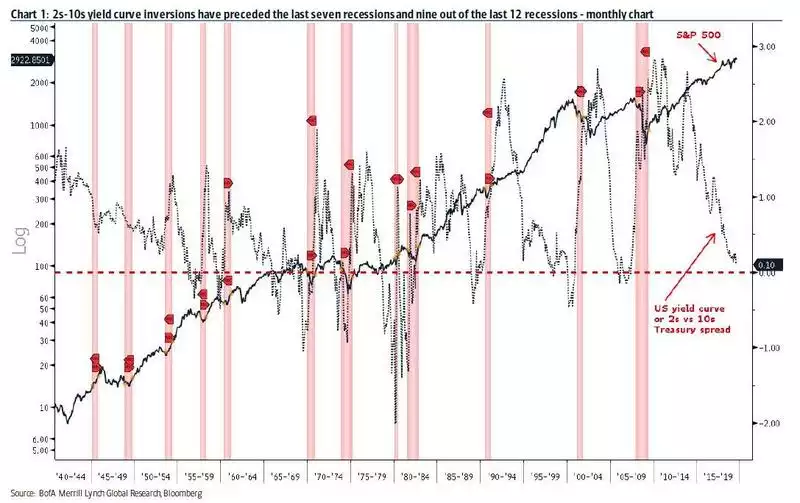
The median time from inversion to a recession is 2.6 months (or 7.3 months average). The shot clock is now ticking.
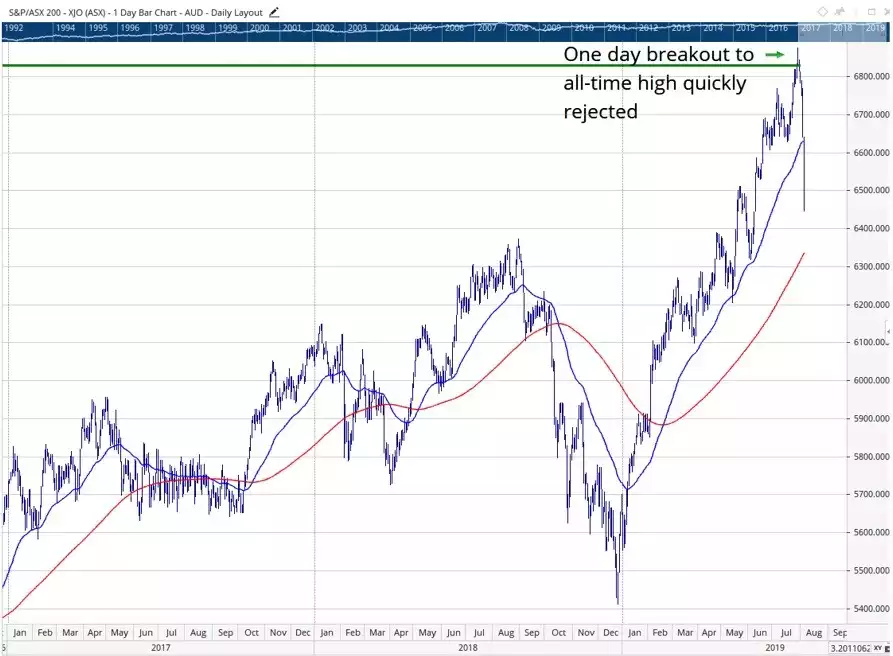
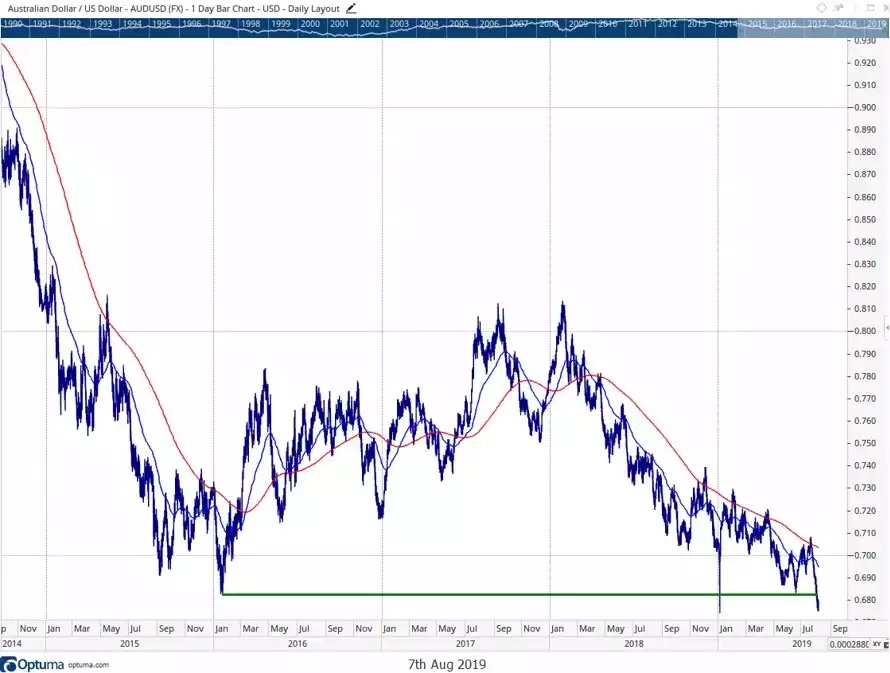
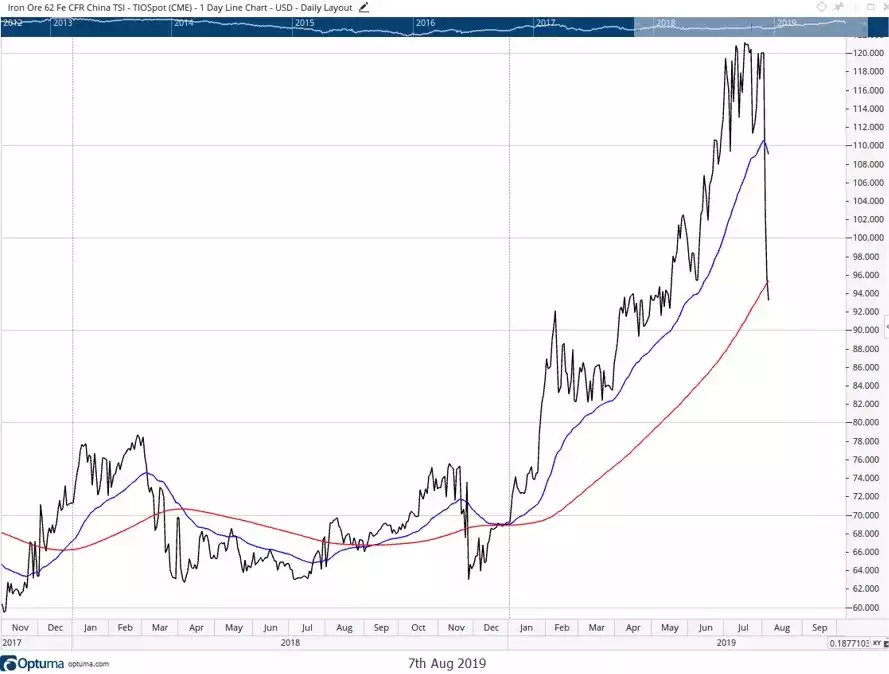
Whilst US shares were down over 3% last night and gold was up 1% and silver 1.5% in USD terms, that poor economic data out of China and a stronger USD saw Aussie dollar gold up 1.7% and silver up 2.3% as the AUD continues its slide. The lucky country’s luck seems to be on borrowed time. Indeed the 3 charts below suggest the slope is now just too slippery… From PPP:
“1. The ASX 200: As you can see in the chart below, it spiked to a new all time high for one day ¬— 30 July — before immediately turning back down. The rejection of the high was then confirmed this week by panic selling.”
“2. The Aussie dollar: Last week, the Aussie dollar/US dollar exchange rate broke through the low from January 2016. It was at its lowest level since the financial crisis. The Aussie dollar is a good barometer of the health of the global economy, and China in particular. Last week’s moves are an ominous sign.”
“3. The iron ore price: Recently, the iron ore price has plunged. This follows a 70% rally from the start of the year. Also, note in the chart below the volatility that occurred in June and July. This is a topping out pattern known as ‘distribution’. In short, it signifies an arm wrestle between the bulls and the bears. That’s what causes the volatility. As you can see below, the bears won…
Last night China posted its worst Industrial Production print in 17 years together with serious misses in retail, fixed asset investment, property investment and employment.
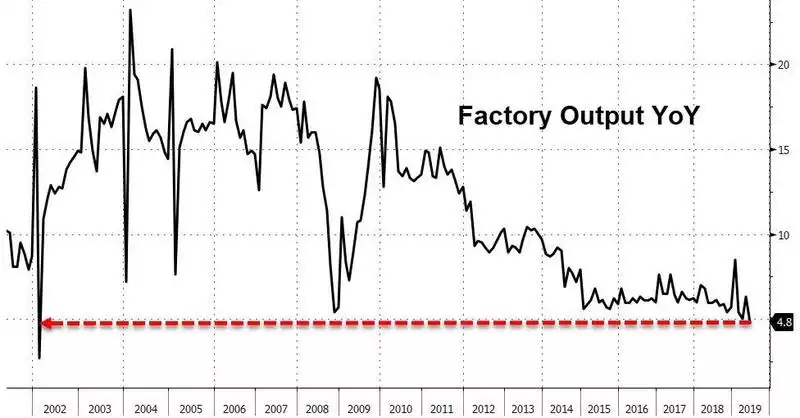
The desperation of the world’s central banks to avert disaster could not be better illustrated than in the chart below.
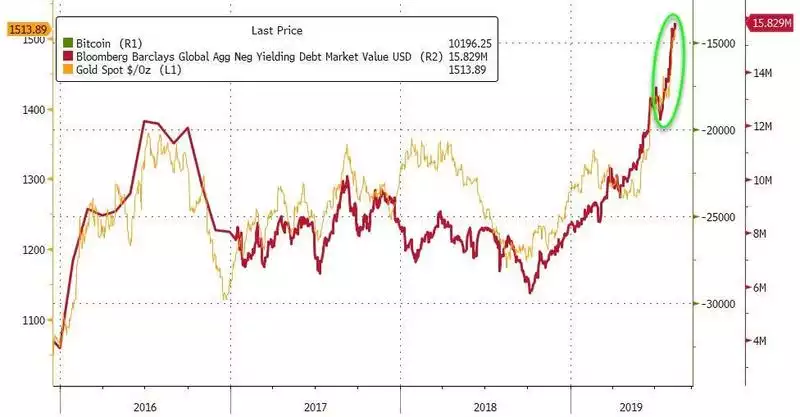
That one bank in Denmark is now offering mortgages at negative 0.5% rates confirms the extent of this distortion. Jyske Bank will pay you to borrow. How does this end in any way but very very badly. The market is turning to the conclusion that it can’t, and it is piling into gold and silver. The problem is gold has only $1.5trillion in tradeable metal. How’d does that market handle even a small percentage of the circa $300 trillion in financial assets fleeing to it? Silver is even smaller. There in theory is only one variable, price but as we have seen before in such times actually getting your hands on it when full panic sets in can be very difficult.
We often recite the saying ‘better a year too early than a day too late’ for buying your safe haven. That may now need to be revised to better 2.6 months too early than a day late....