“Perfect” Recession Warning Explained
News
|
Posted 27/02/2019
|
11382
Something happened Monday in the US that seems to have gone largely unreported. Whilst ‘only’ an intraday event, the 5yr and 2yr US Treasury yields inverted. In essence, in a healthy market you should enjoy a higher yield for a longer term bond than a shorter term given the expectation of additional risk. When people become concerned about the shorter term (i.e. a sick market) you can see an inversion of the yields where longer term yields less than short term. A flat or inverted curve gives banks no incentive to lend money as they rely on the differential to make their money. No lending stalls the economy reliant on more and more debt.
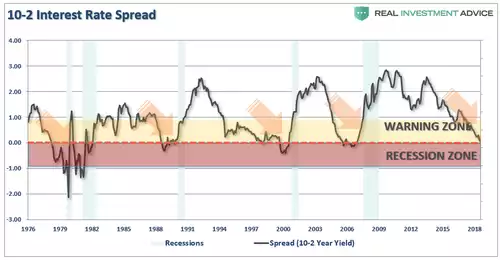
For balance however, this was intraday and on the less ‘watched’ 2yr/5yr compared to the market focus on the 2yr/10yr. You can see below just how close that 2yr/10yr spread is to inverting.
Monday’s 2yr5yr inversion is certainly reinforcement of the market’s concern about the health of the economy. Noticeable in the 2 year auction was the absence of foreign buyers. We’ve reported on numerous occasions recently the decline in global interest in US Treasuries as foreign buyers question the USD’s strength and the US’s growing mountain of debt.
RealInvestmentAdvice’s Michael Lebowitz posits that the market’s fixation on the 2yr10yr spread is misguided.
“Recently, Wall Street and the Financial Media have brought much attention to the flattening and possible inversion of the U.S. Treasury yield curve. Given the fact that an inversion of the 2s/10s Treasury yield curve has predicted every recession over the last forty years, it is no wonder that the topic grows in stature as the difference between the 2-year Treasury yield and the 10-year Treasury yield approaches zero. Unfortunately, much of the discussion on the yield curve seems to over-emphasize whether or not the slope of the curve will invert. Waiting on this arbitrary event may cause investors to miss a very important recession signal.”
Lebowitz reminds us of the increasing debt burden over that same 40 years:
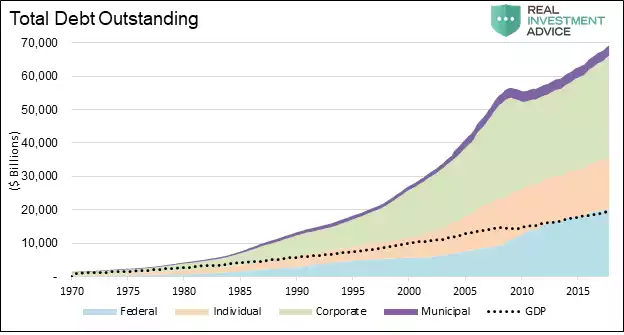
“The graph highlights that debt is growing faster than GDP, with GDP representing our collective ability to service repay our debt. In this situation, it takes increasingly greater amounts of debt and lower interest rates to service the existing debt as well as generate new economic activity.
With this troubling dynamic in mind, think back to the two lending propositions we presented earlier. As the yield curve flattens and, by default, lenders are less likely to lend money and economic activity so dependent on that lending activity, slows.
If you accept that line of reasoning, then you must also agree that economies with larger debt burdens are more sensitive to a tightening of financial conditions. Taking it one step further, the amount of inversion required to generate a recession in such a scenario also declines. Might we now be at the point where inversion is not required, and a flat enough yield curve will hamper borrowing and stymie economic activity?
Based on history, one may deduce that if the curve were to steepen from this point, the odds of a recession decline. We strongly disagree. Given the incremental debt accumulation that has occurred as compared to the accumulation before those five prior episodes, financial conditions have more than likely already tightened enough to induce a recession. The recent steepening of the curve, which might be misinterpreted as a relief, is a flashing red signal that a recession is still very much possible.
For those of you that are stubborn and waiting on the curve to go to zero to sound the recession warnings, we share the graph below, courtesy of Crescat Capital LLC.”
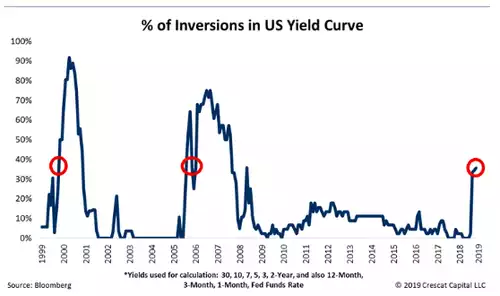
“The graph looks at numerous yield curves and computes the percentage of them that were inverted at various points of time. Note that about 40% of curves are currently inverted. Have the collective curves already sounded the alarm, but everyone is too focused on a flat 2s/10s curve to hear it?”