10 years of negative returns or the tipping point?
News
|
Posted 13/09/2021
|
5872
Wall St had another bad night Friday night, capping off the worst week on the S&P500 since mid June and the first 5 day losing streak since February. The question of course is where to from here?
As a reminder we are in the guts of September, historically the worst month for shares. The VIX surged back above 20 as fear spread. Major investment houses continue to shout warnings about a correction with Deutsche Bank’s chief equity strategist calling most valuations "historically extreme" and spelling that out - "trailing and forward price to earnings (P/E), enterprise value to EBIT, EBITDA or operating cash flow are all well into the 90s in percentile terms. High valuations are broad based across sectors and median company valuations are high."
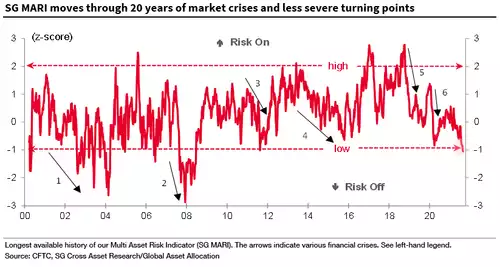
Société Générale have their proprietary Multi-Asset Risk Indicator (SG MARI) and despite us being at near all time highs, it just went into the danger zone of their deep ‘risk off’ (selling) territory for the first time since the 2012 Euro banking crisis kissed it and the GFC plumbed it.
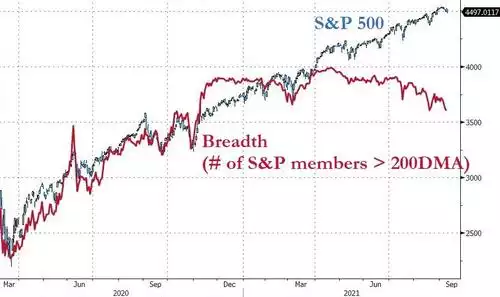
We spoke about market breadth here, and that warning continues to flash as the price and breadth continue to extend their divergence making for a very precarious market:
And so we find ourselves seemingly at this critical juncture many have speculated around. If indeed ‘reality’ has finally caught up with this market and we have a major correction, what then? Bank of America look at the price to normalised earnings of the S&P500 and then what that means to the subsequent 10 years of returns. The chart below maps out the remarkable accuracy of this metric going all the way back to 1990. For the first time since the dot com bubble it is now forecasting negative returns for the next 10 years if you bought into the S&P500 now.
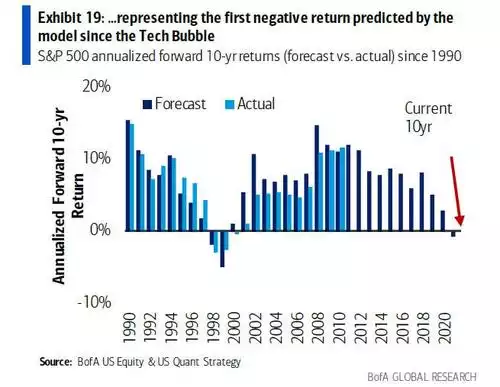
Critically this model ‘saw through’ the GFC on the back of the Fed unleashing QE. It highlights the extent to which this market is distorted and the losses that can befall investors who think such gains can go on forever and that ‘over the long haul shares always go up’. Aussies, without the Fed’s QE, took over 10 years to regain the losses of the GFC…
But, and it’s the $8.5 trillion but, will the Fed and US government really ‘allow’ the US sharemarket a negative return for a decade? Clearly not, and that is where gold and silver become particularly enticing, and not just from a traditional safe haven perspective. Beyond that there is already a surge in recognition around monetary debasement and a system hurtling toward the ‘reckoning’. What the reckoning is, is anyone’s guess. However this system simply cannot keep adding more and more debt (to already record levels), print more and more currency, and inflate every soft/financial asset, nor even ‘hard’ assets like property well beyond valuation fundamentals with zero interest rates forever. At some stage, maybe this time when the Fed start buying shares like the Bank of Japan were forced to do, there will be the rush for the door as it all implodes on a loss of confidence.
This is the critical piece in the investment thesis for precious metals and one Mark Mobius spoke to recently. If there are around $300 trillion of these ‘soft assets’ in the world and even a fraction of them try to get into the hard asset $1.5 trillion investible gold space or the just $50 billion silver space, neither the door nor the room beyond it can fit even a small fraction. Only hugely higher prices increase the size of these 2 rooms.