What the Yield Curve Inversion Means
News
|
Posted 06/12/2018
|
6458
Financial markets commentary is still abuzz with speculation about what the inversion of the US Treasury yield curve means as we covered briefly yesterday. Last night the US public holiday gave Wall St a rest from the big falls the night before but gold and silver continued to rally.
Today we look a bit deeper at the yield curve issue. Firstly, Yahoo Finance summarised the current situation nicely as follows:
“The bond market is beginning to sound the alarm of a recession, with an inversion in U.S. Treasury yields occurring on Monday for the first time since 2007.
The yield on the 5-year Treasury note fell below the yield on the 3-year note, meaning that investors were being paid more to hold U.S. government debt maturing in three years than comparable bonds maturing in five years. It’s not the major curve inversion that investors watch for — the 2-year note holding a higher yield than the 10-year note, which has preceded every U.S. recession since World War II — but it portends that the market is headed in that direction, analysts told Yahoo Finance.[…]
The yield curve inverted between the 2- and 10-year yield before the recessions of 1981, 1991, 2000 and 2008. It has preceded all nine U.S. recessions since 1955, with a lag time ranging from six months to two years.
Analysts have pointed out that although many associate a yield curve inversion with recession, the phenomenon is a reflection of the kind of economic conditions that predict a market bust rather than being the cause of them.
An inverted yield curve is a sign investors think the government is less likely to pay back debt it owes in two years than what it owes in a decade — or in this case, the government is less likely to pay in three years than it is in five. Market analysts have pointed to everything from the increase in U.S. debt to cyclical factors like the market running out of steam as reasons for a downturn.”
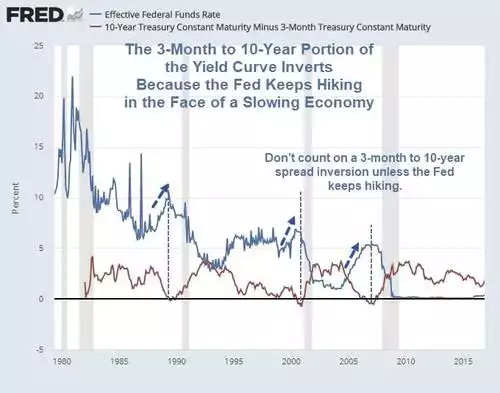
The chart below shows that on each of the last 3 recessions, the inversion of the yield curve occurred as the Fed was tightening (as they are now) into a slowing economy (as we are seeing signs of now).
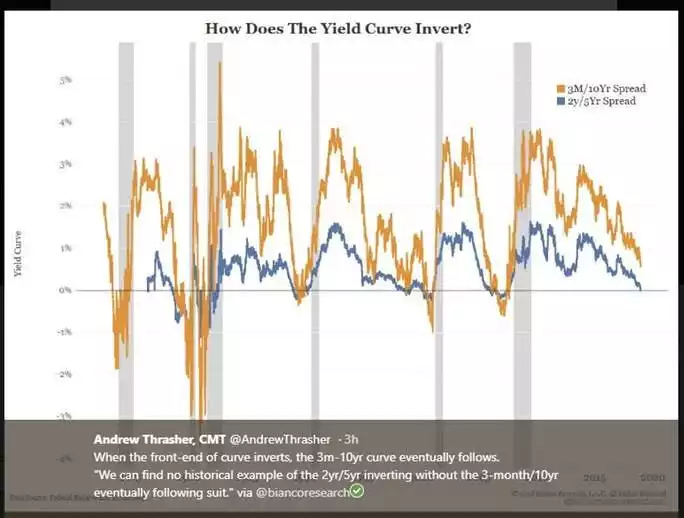
Above is the 3 month to 10 year spread you note? Correct, and the chart below shows it against the 2 year – 5 year spread that just inverted. And as the author, Bianco Research noted: "There has not been one instance where the 2-year 5-year spread inverts and the 3-month 10-year spread didn't."
And so a lot of the debate at present is whether the 2yr – 10yr spread will invert or likewise the above depicted 3m – 10yr (the 2 more closely watched recession indicators) and whether that either needs to happen to have a recession or whether it means the Fed will stop hiking and avert disaster. In reality neither is a forgone conclusion.
What it fundamentally means is the market believes, as “Bond King” Jeffrey Gundlach said this week, that the “economy is poised to weaken”.
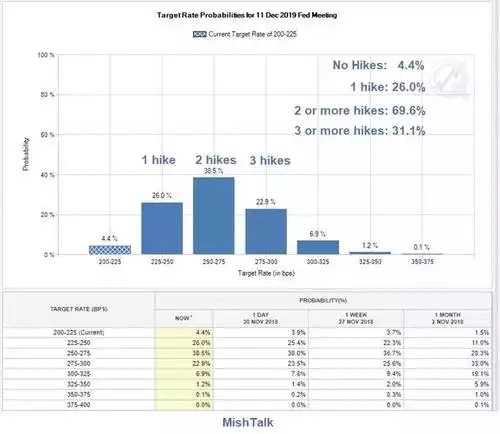
Conversely, the market odds are still strong for more Fed hikes. Via CME FedWatch per the chart below it still believes there is a 70% chance of at least 2 more hikes next year.
Arguably the damage is already done with the premature tightening already undertaken. The curve is certainly indicating that is the case. The big question is what happens as the Fed inevitably continues tightening. History indicates this may be baked in the cake already. Whilst everyone is looking for the inversion of the 3m-10yr and 2yr-10yr as the ‘certain sign’, Japan (another proponent of the type of monetary stimulus the Fed is trying to end) has shown on multiple occasions the yield curve does not need to invert to get a recession. So whilst inversion is not a requirement for a recession, the trend we are currently witnessing is certainly a very strong indicator one is imminent.