US Sharemarket in Context – Record highs still…
News
|
Posted 25/06/2018
|
6209
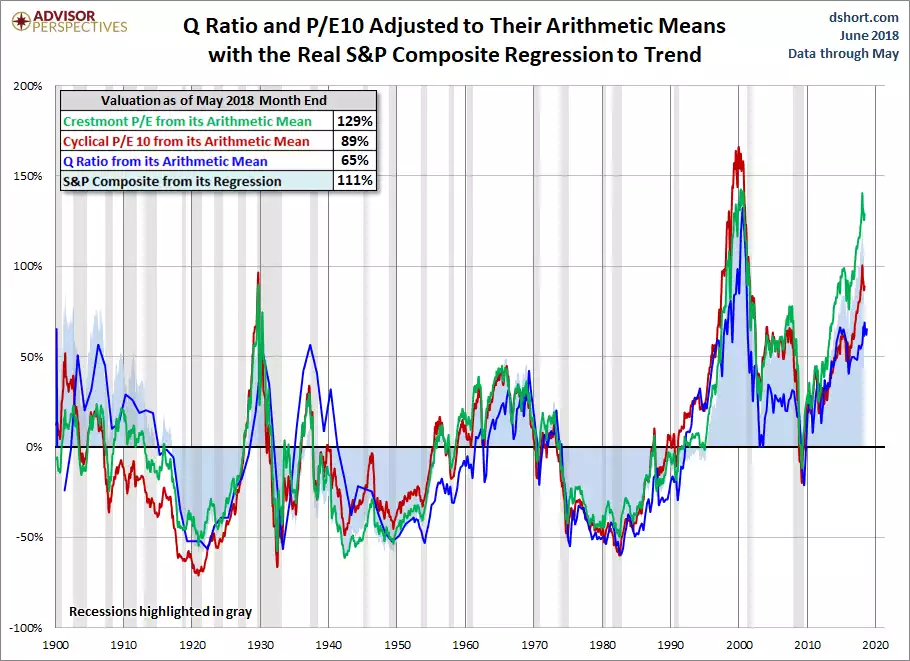
The good folk at Advisor Perspectives have provided an update on their Four Valuation Indicators for the world’s biggest share index, the S&P500. We’ve brought you these a few times before and it is worth revisiting given there is a perception by some that because the US sharemarket has gone nowhere this year that valuations might be back into friendlier territory. As a reminder, these are the 4 they use as the best indicators of the market’s relative value, and where they sat earlier this month:
- The Crestmont Research P/E Ratio
124% above its arithmetic mean and at the 99th percentile of this fourteen-plus-decade monthly metric
- The cyclical P/E ratio using the trailing 10-year earnings as the divisor
The P/E10 is sitting at 86% above it’s arithmetic mean and 97th percentile. For context of accuracy, since 1881 this metric has a 0.9977 correlation with the real (inflation adjusted) S&P500. 1 is perfect.
- The Q Ratio, which is the total price of the market divided by its replacement cost
The current 1.12 ratio has only been exceeded once in over 100 years, in 2000 in the dot.com bubble. It’s currently 63% above its arithmetic mean, again the highest ever apart from 2000.
- The relationship of the S&P Composite price to a regression trendline.
At 111% it is the highest EVER other than the dot.com bubble.
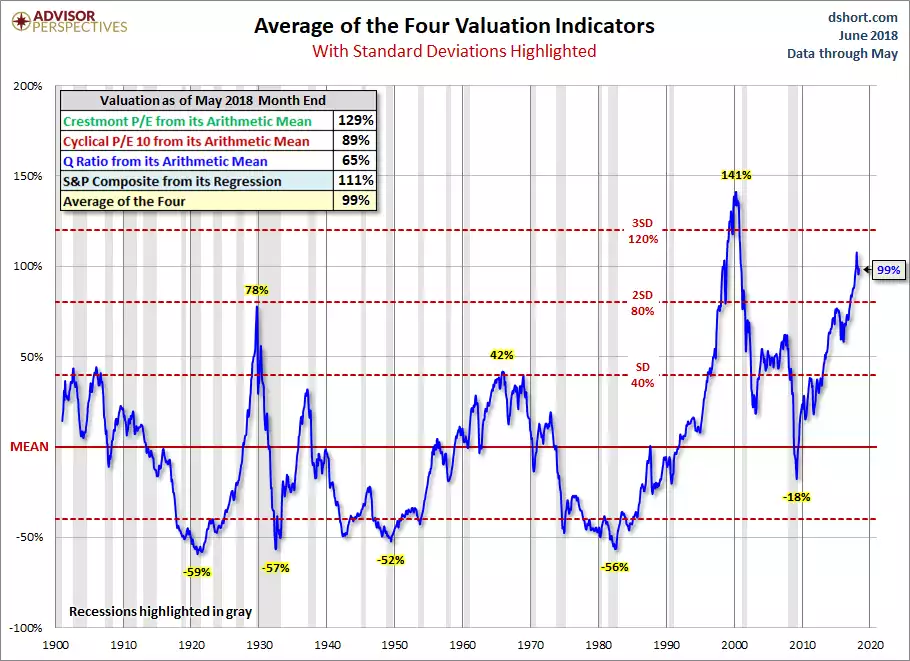
Graphically that all looks like this:
And:
But apparently ‘everything is awesome’ and this time is different…