Solar Demand for Silver Surges
News
|
Posted 14/10/2020
|
8783
Earlier this week we shared that excellent infographic part of which showed that silver use in photovoltaics accounts for around 10% of total silver demand. Demand and indeed investment in the PV sector is getting stronger on the back of the likes of the EU green targeted stimulus and the growing prospect of Biden winning the presidency and his clearly articulated green energy agenda.
Indeed silver is often seen as a better play in a reflation environment that might be the result of the extraordinary amount of fiscal stimulus expected out of Biden (and let’s face it, likely under Trump as well). Silver’s dual role of monetary metal and industrial metal sees it win both ways in the sense of an inflation hedge and demand from the darling sectors of electronics and renewable energy.
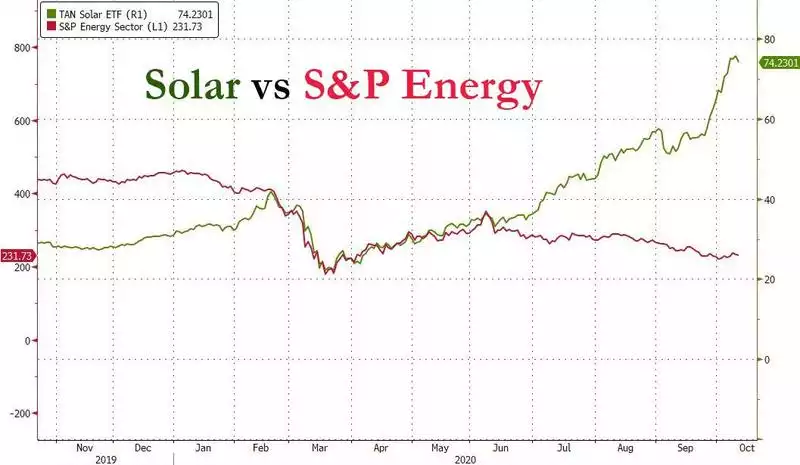
Since June of this year, as a Biden win was looking more on the cards and his platform clearer, we have seen ‘traditional’ fossil fuel heavy energy shares slowly decline whilst green (as measured by the solar energy ETF TAN) surge upwards.

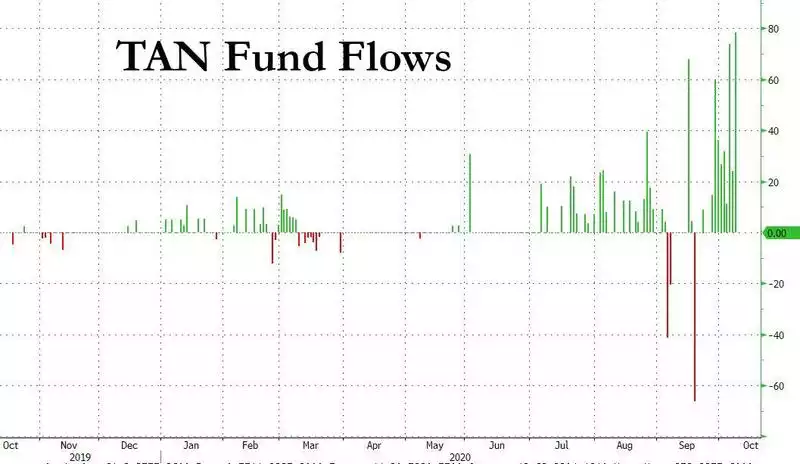
TAN is the Invesco Solar ETF that comprises purely companies in that space. TAN is grabbing the headlines with huge inflows into AUM and being up 260% from its lows this year, one of the best performers of the year. The chart below shows the fund inflows from mid this year.

TAN however is not alone, with similar performances from First Trust NASDAQ Clean Edge Green Energy Index ETF (QCLN), KraneShares MSCI China Environment Index ETF (KGRN) and Invesco WilderHill Clean Energy ETF (PBW).
The space has certainly caught Goldman Sach’s eye:
“..with global infrastructure stimulus tilting towards renewables, and solar in particular, silver stands out in the metals space as the obvious beneficiary. Solar investment accounts for around 18% of silver industrial demand, or 10% of silver total demand.
Our Equity analysts’ base case is that global solar installations will increase by 50% between 2019 and 2023 as the greenification trend accelerates. Importantly, there are potential upsides even to this ambitious target. Former US Vice President Biden has proposed a plan which involves installing 500 million solar panels in the US alone over the next 5 years. Our Equity analysts estimate that this could boost installation of US capacity from 15 GW per year to 30 GW. This represents a boost of almost 15% to global solar installations. Importantly, our Chinese clean energy team see potential upside to Chinese solar panel installations in the new 5-year plan. In their view, Chinese installation could reach 93 GW per year vs the current figure of 50 GW. This would represent a 40% boost to global installations.”
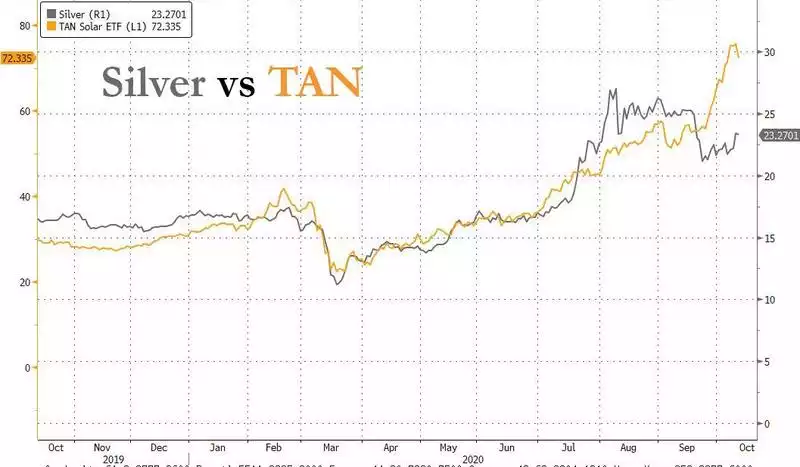
The correlation between the silver price and the TAN ETF (as a proxy for solar industrial demand) has been quite tight per the chart below. More broadly, the silver price’s beta to industrial demand is 1.07, i.e. slightly higher (compared to 1.55 to the gold price, as expected given silver sees bigger highs and bigger lows compared to the yellow metal).

All up this has left Goldman’s still bullish on silver:
“Earlier this year we initiated a long silver trade recommendation, and then closed out of after silver prices rallied by 50%, briefly touching our $30/toz target. Now, with silver at $24/toz and a few potential upward solar surprises in the coming months, we reopen the trade.”
It must be noted that this is appears skewed to them looking at it predominately through the lens of industrial demand and arguably underestimating the monetary or precious metals tailwinds the product of all the same stimulus should inevitably see play out in inflation based investments.