Share Bear v Bullion Bounce
News
|
Posted 11/02/2016
|
5022
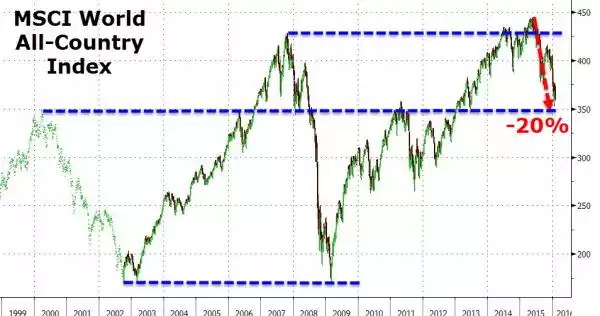
In technical terms a bear market occurs when the price declines 20% from its recent high. You probably saw on the news last night that this happened on the Australian sharemarket yesterday. But we are not alone. The first chart below shows the MSCI World Index (a basket of all substantial sharemarkets) is also now in bear territory, down 20% on the April 2015 high. Just as the S&P500 chart presented yesterday shows, whilst that might feel like ‘enough’ it is still minor compared to where crashes historically end up. The takeaway? Thoughts of it being too late to bail out may well be unfounded…. There can be a lot more pain to come. Now where to put that liquidated cash? Read on below the first chart…
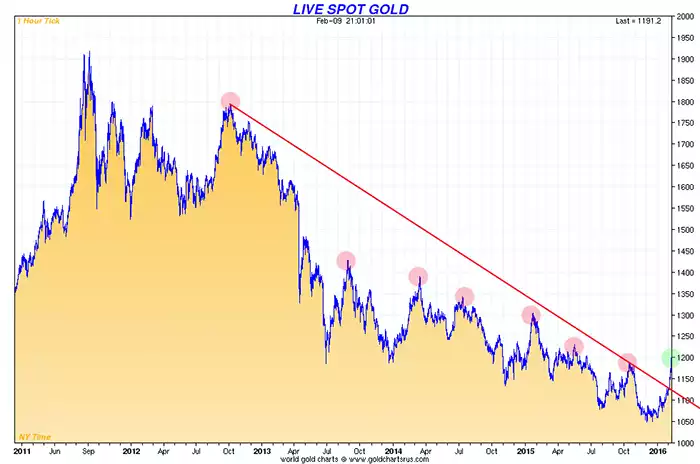
A key technical trading rule is that a market is not considered to have ‘turned’ until it makes a higher high to the last spike. The chart below shows clearly that each cycle high was lower than the prior one for the last (painful) 4 years…. until this one! The one number sceptical analysts are still watching like a hawk is the USD1200 spot price. At the time of writing it was just $2.20 off that….