New Records Hit on Debt
News
|
Posted 28/08/2017
|
6323
Sometimes a graph can do all the talking…. You should be sitting up and listening to the following graphs. Firstly let’s get an update on the margin debt on the New York Stock Exchange (NYSE), being the amount of money borrowed on margin to buy shares…
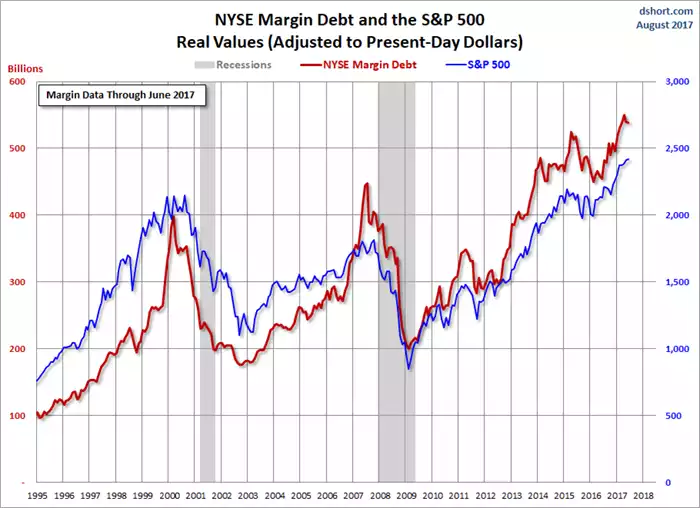
You will note two things. First, the S&P500 coincidentally hit a new all-time high as did the amount of money borrowed to get it there. That was fundamentally the role of QE (Quantitative Easing) and ZIRP (zero interest rate policy)… get you borrowing and making everything look awesome beyond lagging fundamentals. You might also notice an historic trend of a sharp reduction in margin debt preceding each sharemarket crash. The above graph was released by the NYSE as at end of June, it would be interesting to see if that red line has dropped since then.
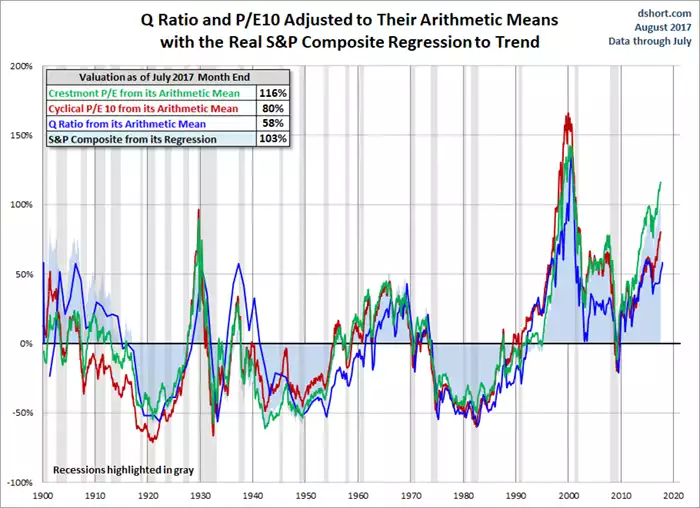
Certainly valuations are not looking any better as at July… Remember the classic quote from Warren Buffet… “Price is what you pay and value is what you get”.
Finally, leaving Wall Street and looking at Main Street, American households just passed an ominous threshold…. US Household Debt is now higher than it was before the GFC, another new all-time record high. Reminder: US Mortgage debt was the catalyst for the GFC…
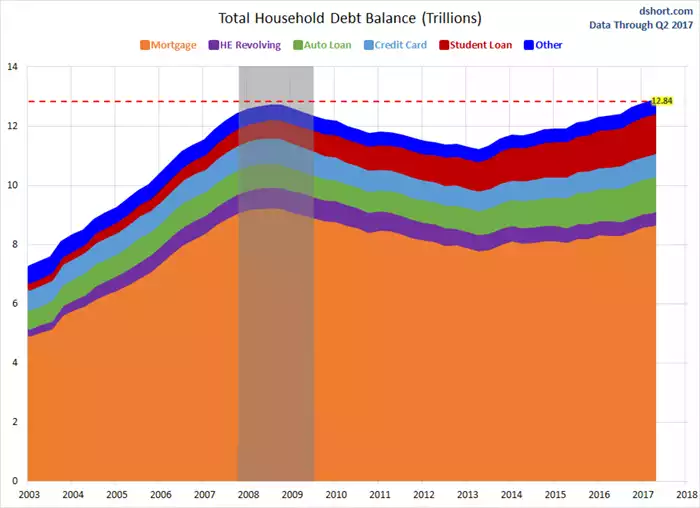
What might be a little more concerning is the phenomenal growth in auto loans (you know, low doc loans on depreciating assets…) and student debt amongst that mix.
Debt is making things look better than they are right now, but that burden of debt always has the same ultimate outcome.