Bear Markets Author the Bull That Follows
News
|
Posted 24/05/2022
|
7046
After the industry-wide sell-off alongside the collapse of LUNA and UST last week, markets have entered a period of consolidation. Bitcoin prices traded within a relatively tight range between a high of US$31,300 and a low of $28,713.
The Bitcoin market has now traded lower for eight consecutive weeks, which is now the longest continuous string of red weekly candles in history. Bitcoin has historically traded within an approximately 4yr bull/bear cycle, often associated with the halving events. The chart below plots out the rolling 4yr Compound Annual Growth Rate (CAGR) for Bitcoin.
CAGR, has declined from 200%+ in 2015, to less than 50% today. In particular, we can see the marked decline in 4y-CAGR following the May 2021 sell-off.
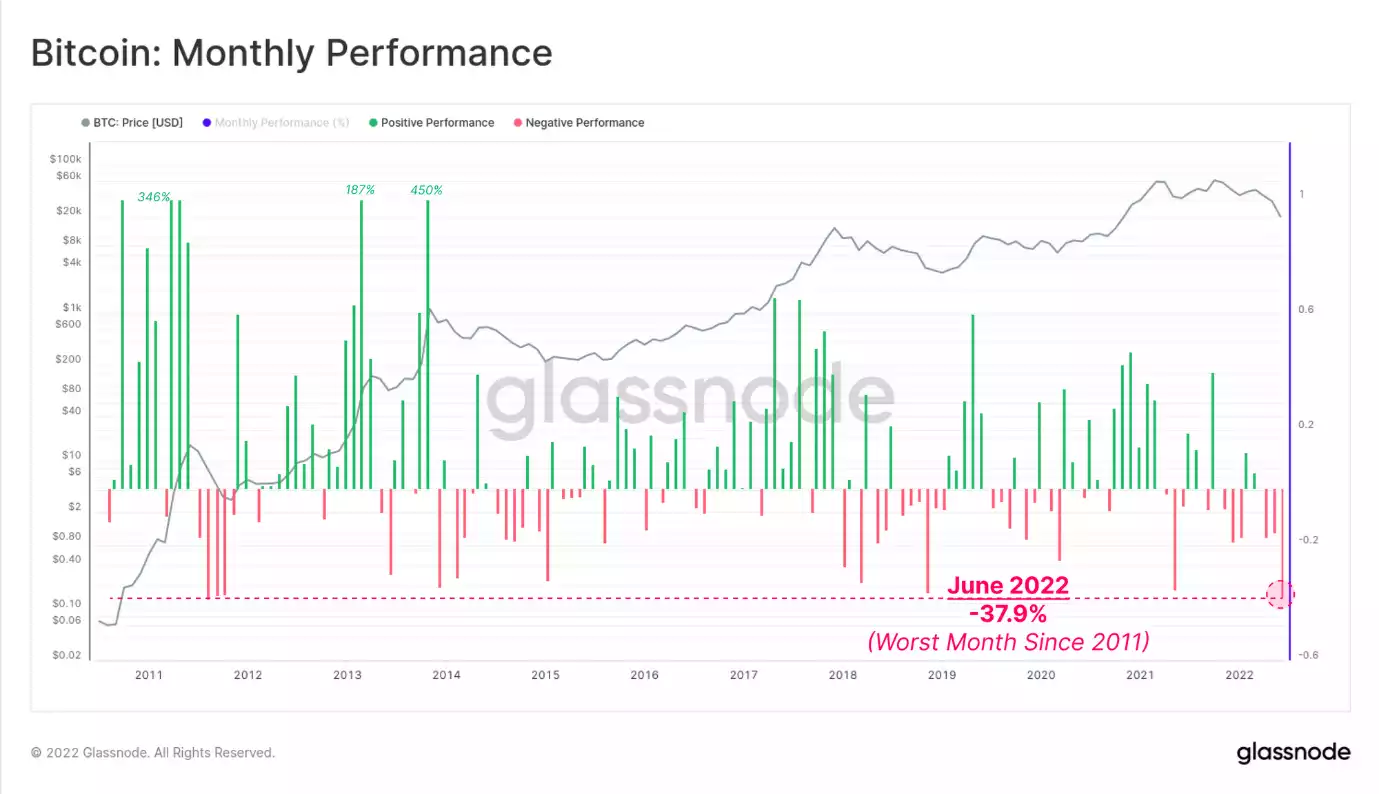
In the shorter term, we can also see that the Monthly Return profile for Bitcoin has been underwhelming, with a negative performance of -30%. In effect, Bitcoin has lost 1% of its market value every day over the last month.
This negative return is now marginally worse than it was during the 4-Dec deleveraging, but not quite as severe as in May-July. Periods with monthly returns this lacklustre are relatively infrequent, however, are almost always associated with high volatility drawdown events such as the beginning, and ends of bear markets.

We can see a very similar return profile for Ethereum over recent months, although with a relatively worse performance of -34.9%. This demonstrates that the correlation of performance between these two assets remains strong, despite numerous differences in their fundamental properties.

Further to this, we can see an interesting coupling between Bitcoin and Ethereum CAGR performance, specifically during bearish trends. In the post-March 2020 period of uncertainty, and again since the bear began in May 2021, the CAGR profiles of both assets have converged. Ethereum appears to also be experiencing a diminishing return profile over time.
ETH has generally outperformed BTC during bullish trends, however, these divergences do appear to be getting weaker over time (lower upwards divergences). In more bearish trends, it can be seen that the ETH CAGR often tends to underperform BTC.
Over the last 12-months, the 4yr CAGR for both assets has declined from around 100%/yr to just 36%/yr for BTC, and 28%/yr for ETH, highlighting the severity of this bear.

Bear markets can take their toll, and this particular bear has done just that. What we can observe is a relatively cohesive story of poor price performance, diminishing long-term returns, fear of being priced into near-term derivative markets, and a side of the lacklustre on-chain activity – all signs of a later stage bear market.
This effect is relatively universal across the digital asset market, with both Bitcoin and Ethereum seeing dramatically lower utilisation and demand relative to the bull market. For DeFi tokens, even more so. There are signals that internal capital rotation is towards BTC at this time, perhaps punctuated by the LUNA and UST collapse last week. Such a rotation is a historical characteristic of bear markets, as investors move towards perceived safer assets.
Nevertheless, bear markets have a way of ending. As the saying goes 'bear markets author the bull that follows'.
Keep an eye out for our next drop of Gold Silver Pirates NFT’s after round 1 sold out. Nothing like holding gold denominated in ETH when gold is holding strong and ETH in a bear market!