“Fiscal Populism” – Trump v Fed
News
|
Posted 05/11/2018
|
8139
Tomorrow the US goes to the polls for the mid term elections. The implications either way are enormous. Trump, who has already delivered significantly more spending ‘making things great’ whilst simultaneously reducing income through corporate tax cuts, is now even talking about personal tax cuts as well just days before the election. Increasing spending against decreasing tax income of course means more debt required, some $21.7 trillion and counting…
This of course is not without precedent. Indeed the US hasn’t run a real surplus since they left the gold standard. The chart below illustrates the main culprits:
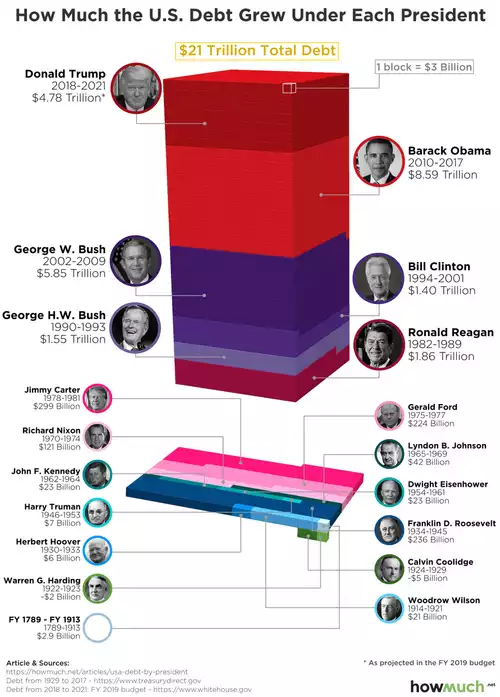
Now Trump’s figure is per their FY19 budget figuring no recession over the period to 2021. If you believe that then there is doubtless a newly funded bridge you could buy for a bargain too. In reality, per most projections, the US will likely experience a recession within that period and we will therefore likely see increased spending against decreased income and that $4,780,000,000,000 over just 3 years will increase significantly.
Now Trump was arguing that decreasing corporate tax would see that money go to the workers and we would see increased personal tax income. So how’s that going?
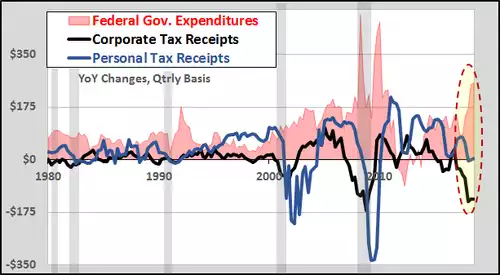
If that’s not clear, you are looking at both corporate and personal tax income dropping. Zooming in a bit:
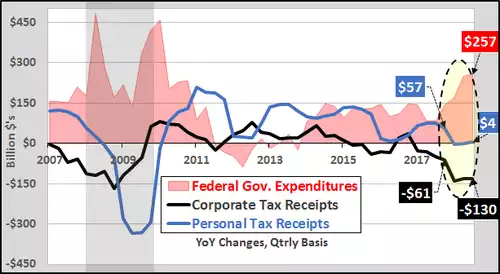
This is the sort of phenomenon you see during a recession and the central bank (US Fed) would be easing rates to try and counter it. However, and this is potentially a massive however, what we have now for the first time since WWII, is the Fed tightening into such an environment. And remember, this is not just increasing rates, but also unwinding their balance sheet which reached $4.5trillion from printing all that money during QE, by $50 billion every month. The chart below shows just the last 30 years.
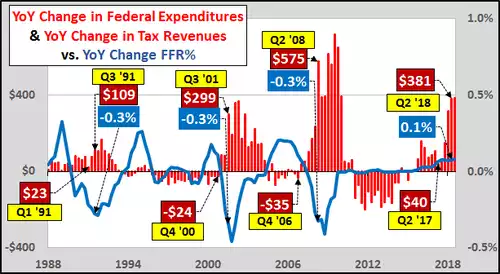
From Econimica (authors of these charts):
“The last chart details the never before seen (at least post WWII) divergence of counter-cyclical monetary and pro-cyclical fiscal policy. Red columns are the quarterly year over year change in federal spending plus year over year change in federal tax revenues (increases in federal government spending and federal tax revenue decreases shown together as stimulus...decreases in spending and rising tax revenue shown as economic constraint). Blue line is quarterly year over year change in the Federal Funds interest rate.
Until now, increased federal spending coupled with lower tax revenue collected act as an economic stimulant typically in sync with interest rate cuts. However, the president and Congress are undertaking large spending increases and reducing taxation to gas the economy (typically in-line with the onset of an economic crisis) while the Federal Reserve is moving in a pro-cyclical direction raising rates (plus selling off $50 billion/month from it's balance sheet) in an attempt to stomp the brakes on the economy.”
That analogy of pushing the accelerator and brake at the same time highlights the absurdity of the current situation. As more and more debt is created interest rates are going up higher and higher, making debt interest servicing higher and higher. Whilst most know Fed tightening has preceded nearly every previous crash, never have they done so into such an environment.