Where could this gold bull go? - If history repeats
News
|
Posted 29/07/2021
|
12182
Previous bull markets in gold have seen explosive moves to the upside in both dollar and percentage terms. Since the closing of the Gold Window in 1971, gold has seen two significant bull runs play out: 1971 - 1980 and 1999 - 2011. A number of commentators have argued that the low of US$1040 reached on 16 December 2015 was the bottom of the present long-term bull run.
The bull run of the 1970s saw gold float from $35/oz to a double top of $850 a move of $2,240%. The second bull run in the 2000s saw prices move from $250 to just under $2000 at the highs.
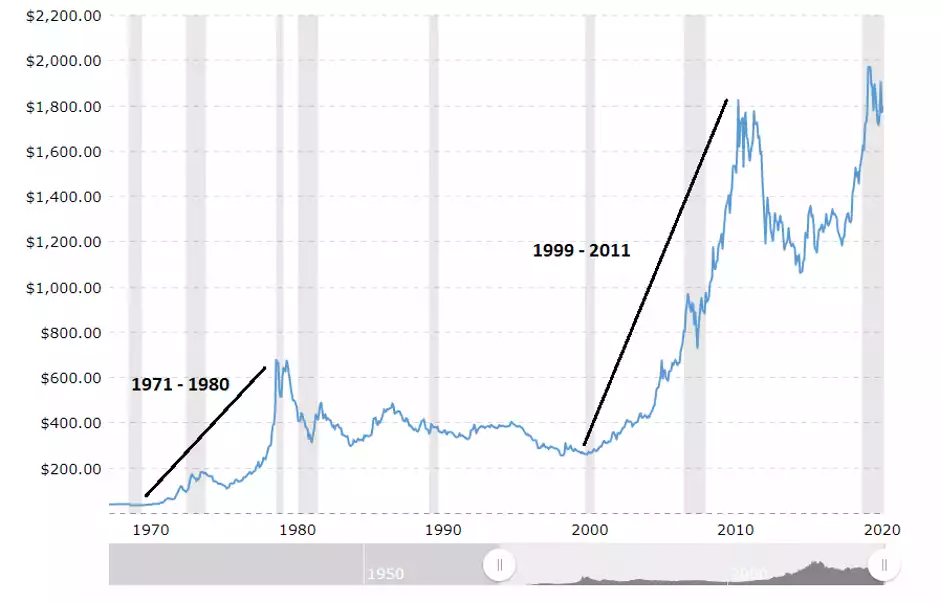
Source: Marcotrends.net, not inflation adjusted, non-logarithmic
To the casual eye, the change in the first bull market seems significantly smaller than in the second. The following table refers to gold ounces denominated in USD.
|
Bull Run
|
Low
|
High
|
$ Change
|
% Change
|
|
August 1971-
January 1980
|
$35
|
$850
|
+$815
|
+2,420%
|
|
August 1999 -
September 2011
|
$251
|
$1,912
|
+1661
|
+760%
|
|
|
|
|
Average
|
+1,590%
|
Granted, the highs calculated were intraday and represented massive blowoff tops. However, if we were to apply these scenarios to the current bull market it may provide an insight into how high gold may go. If we see a repeat of the 2000s, from a low of $1,040/oz, we would expect to see a high of $7,904. While we may never again see a percentage move such as what we saw in the 70s, gold bugs would have cause for celebration at $25,000/oz gold.
|
Scenario
|
% Change
|
Low
|
High*
|
|
2000s bull market
|
+760%
|
$1,040
|
$7,904
|
|
1970s bull market
|
+2,420%
|
$1,040
|
$25,168
|
|
Average bull market
|
+1,590%
|
$1,040
|
$16,536
|
The other notable thing in the above charts is the intra bull run “bear trap” that has happened each time. A “bear trap” is part of the oft repeated phases of any market cycle as you can see below:
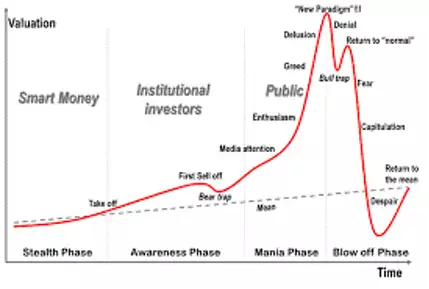
You will note in the first chart above we saw such a “bear trap” (so named as it fools the bears that the bull run is over) around 1975, again in 2008 and again last year. From these psych out’s we then normally see the rally really take steam as the weak hands are flushed out.
Another point of note, is that we are only five years into the present bull market, based on previous cycles, we may have another five good years before a blow off top. We probably don’t need to remind you that past performance is no guarantee of future results, but let’s hope it’s similar. As they say, history doesn't always repeat, but it often rhymes….