WGC Gold Demand Q2 2022
News
|
Posted 01/08/2022
|
14272
The World Gold Council’s quarterly Demand Trends report for Q2 2022 have just been released and as usual we summarise for you.
Overall
Despite Q2 weakness, strong first quarter ETF inflows fuelled a notable H1 recovery.
Gold demand (excluding OTC) was 8% lower y-o-y at 948t. Combined with Q1 this took H1 demand to 2,189t, up 12% y-o-y.

Investment
- Gold-backed ETFs gave back some of their Q1 gains as global holdings declined by 39t during Q2
- The picture for H1 remains strong, with net inflows of 234t (US$15bn)
- Bar and coin investment was unchanged from Q2’21 at 245t, generating an H1 total of 526t (-12% y-o-y).
- COVID-induced lockdowns triggered the worst Q2 for Chinese retail gold investment since 2010; bar and coin demand fell 35% y-o-y to 37t.

Central Banks
- Central banks bought 180t of gold in Q2, lifting H1 net purchases to 270t
- Gold’s performance during a crisis and its role as a store of value are key drivers of central bank demand for gold
- Chunky purchases from a small number of banks helped offset modest selling elsewhere.
Jewellery
- Q2 jewellery consumption was 4% higher y-o-y at 453t as growth in India and the Middle East outweighed declines in China and Russia
- Demand remains anaemic on a longer-term basis, 10% below the five-year quarterly average of 505t
- H1 total demand (928t) was 2% down on H1’21, but 12% below 2019 pre-pandemic levels.


Technology
- Gold used in industrial applications fell by 2% y-o-y to 78t during the second quarter.
- The electronics sector – the largest single industrial user of gold – fell by 3% y-o-y to 64t during the quarter
- At 159t, H1 technology demand was marginally below the first half of last year, mainly due to the slowdown in Q2.

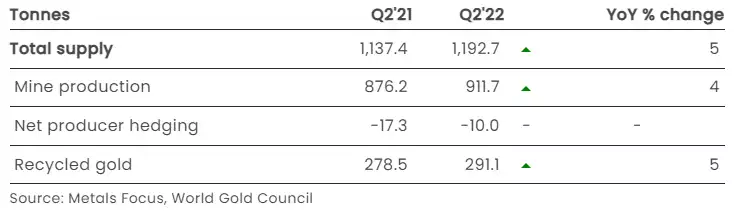
Supply
- Total H1 supply increased 5% y-o-y to 2,357t on higher mine production and recycling supply. Preliminary estimates suggest the industry hedgebook was unchanged in H1
- Mine production in H1 increased 3% y-o-y to a record level as volumes in China recovered following safety stoppages last year and higher grades were mined in large operations elsewhere
- Recycled gold volumes in Q2 rose by 5% y-o-y, lifting H1 recycling to its highest level since 2016.