US CPI Hottest Since 1981 – What Next?
News
|
Posted 14/07/2022
|
16775
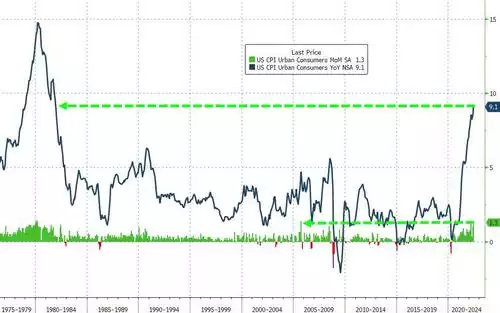
Defying even the worse than last month expectations of an 8.8% CPI print for June, last night’s official print saw a blistering 9.1% YoY headline CPI, shocking financial markets and raising the question – ‘will the Fed hike by 100bps in July?’.
The following chart puts the magnitude into perspective:
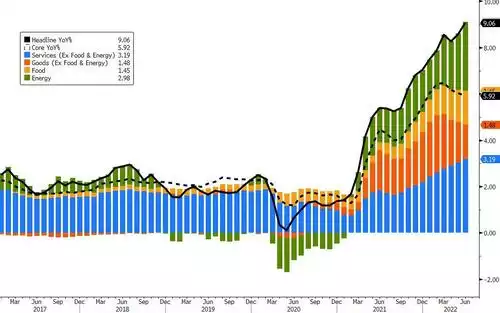
The following chart reaffirms this is inflation across a broad basket and not just energy related. EVERYTHING is surging:
Further to our article yesterday, this is most certainly being felt on Main Steet (and at least now finally affecting Wall Street with more sharemarket losses over night) with wage growth (despite being twice as strong as Australia’s growth) is still falling well behind inflation. Real wages fell for the 15th straight month adding pressure to both Biden but more particularly Fed Chair Powell who very publicly promised to deliver on his 3 core priorities for the American public without regard for the Wall Street crowd who he acknowledged have had a free ride on his loose money policies. His 3 priorities - 1. Inflation, 2. Inflation, 3. Inflation….
And so the market instantly starting betting on a 1% rise this month instead of the previously flagged 0.75%. But it goes well beyond this month. The following chart shows the STIR (Short Term Interest Rate derivative contract trades) showing where the market is betting we go:
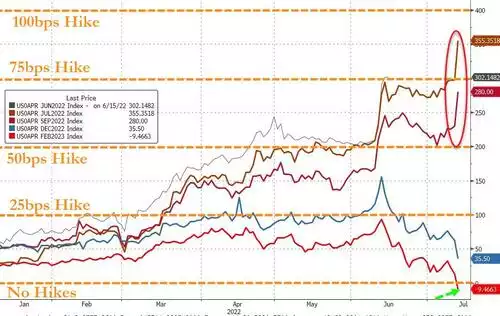
And so we are seeing bets of 66% for an almost unprecedented 100bps rise this month and a 75bps in September a sure thing. But note then that a rate CUT starting in February 2023 as the Fed pivots on the recessionary mess left behind along with whatever credibility it still has.
The bond market is therefore calling this with the 2yr 10yr the most inverted since the dot.com bubble.
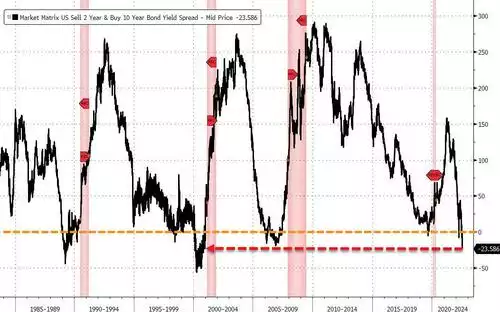
Remember that this unprecedented speed of financial tightening is happening into an already weakening economy.
Refinitiv put together the following chart that presents a composite of the rate of change of oil, gasoline, 2-yr yields, mortgage rates and the US dollar that historically is a near perfect predictor of the ISM (manufacturing & purchasing managers index), probably the best indicator of the state of the US economy. That chart is showing an imminent ISM in the 30’s (!!) where sub 50 is ordinarily a recession. This is saying this will be a deep recession, possibly deeper than any in its history.

However, again in reference to the must read article yesterday, beyond and more important than this US domestic policy and effects, just consider the growing scale of the global macro economic storm this is creating.
Few could honestly claim to know what happens next. “Balance your wealth in an unbalanced world” is just so, so important right now.