The Great Financial Divergence
News
|
Posted 20/01/2021
|
8853
We are currently witnessing a financial fundamentals divergence of an order never before seen.
In one corner we now have ex Fed Chair and ‘uber dove’ Janet Yellen in charge of the fiscal side of things in the US and ‘dove-successor’ Jerome Powell the current Chair of the Fed in charge of the central bank money printer. Both love a good money print. Brrrrr
In the other corner we have precious metals and now Bitcoin as hard monetary assets that no one, regardless of how dovish they may be and in what office they hold, can simply ‘print’ or create more of beyond the fixed constraints of physics, chemistry and maths.
Addressing Congressional lawmakers during her nomination hearings she told them to "go big" on COVID relief spending, hinted at no major tax hikes in the short-term, and raised idea of infrastructure spending as well. This in addition to Biden already laying out the first $1.9 trillion fiscal stimulus package. That, however is in the near future. The Trump administration didn’t exactly go easy. The latest US deficit figures are out and, you guessed it, another record… the worst in 76 years…

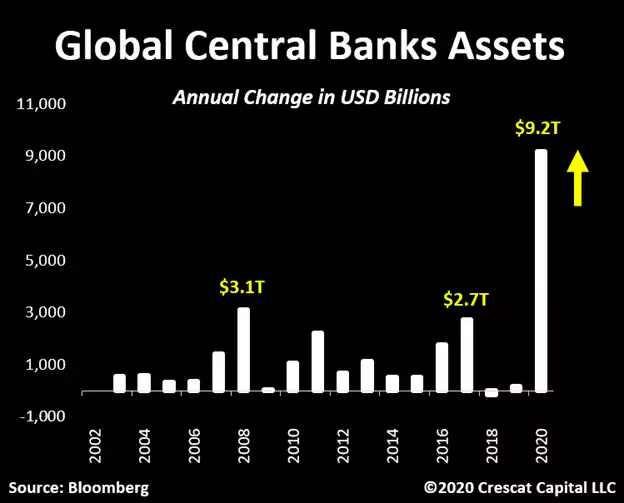
How did they fund that? As chart author Crescat’s Otavio Costa tweeted in reference to the chart below:
“Let this sink in. In November & December the government issued $505B worth of Treasury notes and bonds. The largest 2-month issuance ever. The Fed “only” bought 1/3 of that. No way around this. Monetary policy is clearly becoming a funding tool for the government.”

By contrast we have gold supply that increases by around 2% per year and likewise silver, which when compared to the enormous money supply looks poised to explode:

And then there’s Bitcoin which is actually supply deflationary with the halving of supply every 4 years. From the words of its creator back in 2009:
“Total circulation will be 21,000,000 coins. It’ll be distributed to network nodes when they make blocks, with the amount cut in half every four years. First four years: 10,500,000 coins. Next four years: 5,250,000 coins. Next four years: 2,625,000 coins. Next four years: 1,312,500 coins. Etc. …”
We have written extensively before about the halvings with the most recent just last year. When mapped against stock to flow fundamentals the price action has been remarkably correlated since inception. Fund manager Pantera Capital did a deep dive into this last May in an investor letter and gave a forecast presented below both graphically and in a table with the update to the present day to see how its tracking. Its tracking remarkably accurately with their forecast of US$38,000 by last week bang on. You will note then that they are forecasting $115,212 by August of this year…. Yep, not a typo.


The basis of their projections stems from the historical correlation with halvings and stock to flow analysis as depicted below:

Gold has a stock to flow ratio of around 60, a number it has been for years. That essentially means it would take 60 years of current production rates to get to the current total gold stocks. Bitcoin, with last year’s halving is hot on its heels at 50.
Whatever the number, both PM’s and Bitcoin strike a massive contrast to the currency expansions the world is currently seeing.
Let us leave you with a chart we shared last week that pust this into perspective.
This is incorrectly called ‘monetary stimulus’. This is not money, it is Fiat currency. Real money must have intrinsic value…. History is literally littered with failed fiat currencies. Gold and silver have survived the test of time and Bitcoin is rocketing up to join them as a new ‘pristine asset’.