The Big Squeeze on COMEX
News
|
Posted 03/08/2015
|
7470
Amid stories of supposed falling demand for gold (which we addressed on Friday) there is yet another clear indicator of the exact opposite.
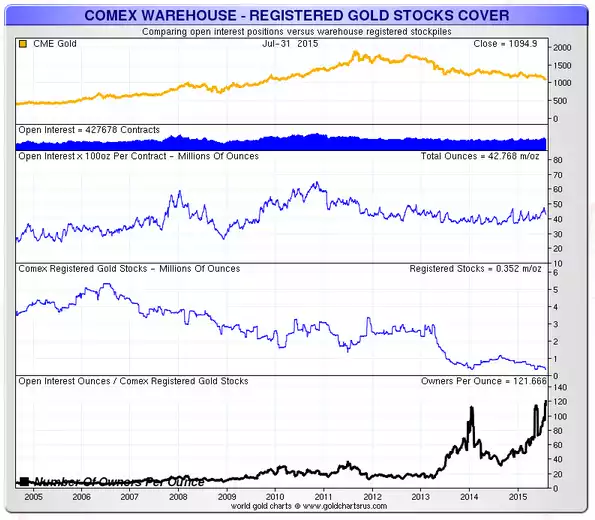
The graph below clearly lays out, from official COT records, the number of futures contracts (Open Interest), the amount of gold available for delivery (Registered Gold) and nicely / scarily summarised in the last graph which shows the ratio of Open Interest to Registered Stock. Yes your eyes don’t deceive – we have a new record of 121.66 “owners” of an ounce for every ounce of gold available – what could possibly go wrong huh…. Welcome to the world of paper trades in gold that, incredibly, largely set the spot price. Another sobering way to look at this is that total value of gold available for delivery is around $390m. In the gold Flash Crash a couple of weeks ago no less than $2.7b was traded in just minutes. All that trade had to be was someone demanding delivery, not just another cash paper trade, and the whole thing blows up.
The other telling insight last week was that a large part of the draw down in COMEX stock was the removal of 222,581oz in 1kg bars (not used by Comex contracts but the mainstay of Chinese imports) suggesting yet again that Asian demand is much higher than being reported.
Indeed in the latest withdrawal figures from the Shanghai Gold Exchange for the week ending 24 July was 73.3t! That is the 3rd highest weekly level of consumption ever (and hot off the previous week being the 5th highest ever).
There is a real game being played out between the paper and physical markets at the moment. Our money is on the physical markets winning and winning in a spectacular way before long.