The BIG Silver Squeeze…
News
|
Posted 15/03/2016
|
7622
Yesterday we spoke about predictions of a silver price breakout on the back of the sky high Gold Silver Ratio, diminishing supply and growing investment demand. What is lost on many people however is the size of the silver market, both in supply and current demand. Relative to other financial investments, both are extremely small. How small? Well 1% of global investment is often quoted for precious metals and silver is likely only 1/3 of that at best.
We’ve spoken before about this and we think it is one of the most critical points for consideration. To graphically quantify this, the analysts from SRSrocco put the following chart together with SilverDoctors who have a guess at silver representing 0.5% of global investment demand (but themselves admitting it is probably on the high side).
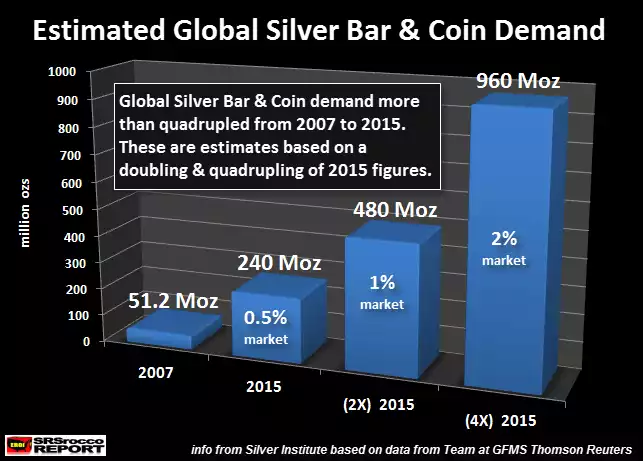
The point of this illustration, when considered beside the annual silver deficits depicted in yesterday’s chart, is that we already have a net deficit on current demand. They calculate current physical investment silver demand (so to be clear, excluding the massive ETF inflows also depicted yesterday) at 240m oz in 2015 (check out the growth since 2007 too!). Applying their 0.5% investment market share estimate to that figure and you see very clearly the impact of just a 0.5% market shift into silver, let alone 4-fold to a still relatively low 2% of the market. That the current 0.5% is in all likelihood lower just magnifies the set up. It is hard to imagine the price action on such an occurrence….It would be a squeeze in the truest essence of the word.
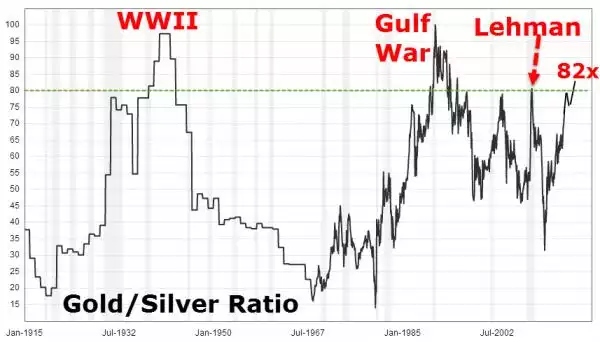
Finally, whilst most Gold Silver Ratio talk is centred on reversion to the mean, the chart below needs little explanation as to a broader context for this high GSR…