Technical Analysis – Gold at 2017 Highs
News
|
Posted 30/08/2017
|
7013
Something different today. One of our favourite technical analysts is Andrew Hecht of the Hecht Commodity Report. He provides a balanced, unemotional view of commodity markets. Here is his latest gold analysis. It’s longer than we normally post but a fascinating read.
“Gold tends to be a thoughtful commodity. The yellow metal has all of the characteristics of a raw material, but at the same time, it is a financial asset and a means of exchange or a currency. The historical volatility of gold tends to be lower than other commodities, but it is typically higher than the foreign exchange instruments of the world. While central banks and monetary authorities manage the exchange rates between their respective currencies, they hold gold as part of their foreign exchange assets. Gold is in a class by itself, and it has been around longer than all other financial instruments. The price of gold is often a reflection of fear and uncertainty in markets, and it is also a barometer of inflationary pressures on the global economy. Gold is an instrument that also has a long history as flight capital.
The price of gold has not traded below $1,000 per ounce since October 2009, and it reached an all-time nominal high at $1,920.70 per ounce in September 2011. In December 2015, gold found its most recent bottom at $1,046.20 per ounce. It moved to a high of $1,377.50 in July 2016, and after making a higher low at $1,123.90 in December 2016, it began to rebound. On Monday, August 28, gold finally traded to the highest price of 2017 as it took out technical resistance and moved above the $1,300 per ounce level.
Gold takes out technical resistance
Active month December gold futures contracts that trade on the COMEX division of the Chicago Mercantile Exchange had been flirting with the $1,300 per ounce level since the middle of August.
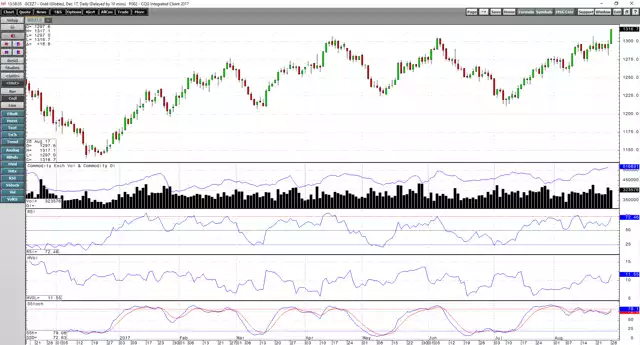
Source: CQG
On Monday, August 28, the patient and thoughtful yellow metal finally took off above $1,300 and rose to a high of around $1,317 per ounce. Gold moved higher as the dollar index fell to a new low for 2017, and bond prices strengthened after the market interpreted comments by Fed Chairperson Janet Yellen in Jackson Hole, Wyoming, as dovish. As the daily chart shows, open interest has been rising alongside price since late July. Open interest is the total number of open long and short positions in COMEX gold futures. On July 31, the metric stood at 436,962, and by August 25, open interest was at 516,831 contracts. Open interest increased by 18.3% over the period. Meanwhile, December gold rallied from lows of $1,211.10 on July 10 to highs of $1,317.10 on August 28, a rise of 8.8%. Rising open interest when the price is moving higher tends to be a technical validation of an emerging bullish trend in the futures market. At the current price, gold is at the highs of this year; it has taken out technical resistance and now has its sights set on the highs from last year.
The next target is the 2016 highs
In 2016, gold hit its highest price since 2014 following the shocking results of the Brexit referendum.
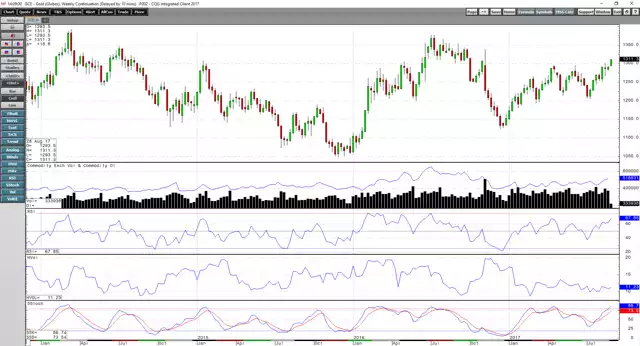
Source: CQG
As the weekly chart illustrates, the next level of technical resistance for December gold futures stands at $1,377.50, the July 2016 highs. Momentum in the gold futures market is currently higher, and gold has been making higher lows and higher highs since last December. If gold can make it above the 2016 highs, we could be looking at a price that is north of $1,400 per ounce.
The signs have been supportive for a higher gold price over recent weeks, and after digesting market action in the commodities and foreign exchange markets as well as on the geopolitical and economic landscape, the yellow metal has decided that it was time to go back into bullish mode.
Other assets and the dollar have been signaling bullish prospects for the yellow metal
We have witnessed a rebound in raw material prices since late May and June of this year. The price of iron ore, the critical ingredient in steel has rallied from $52.31 per ton to over $75 since June 13, an increase of over 43% in two and one-half months. The Baltic Dry Index, which is a barometer of the cost of shipping dry bulk cargos around the world, has moved from 820 on July 10 to over 1,200, an increase of over 46% in less than two months. Copper, the red metal that often diagnoses the state of the global economy has rallied to the highest price since 2014 and is trading above $3.05 per pound, making its latest new high on August 28 at $3.0870. The prices of other metals and minerals have also posted significant gains over recent months.
While gold is a commodity, it is also a financial asset. The rise of a new breed of assets, digital currencies, has been nothing short of spectacular in 2017.
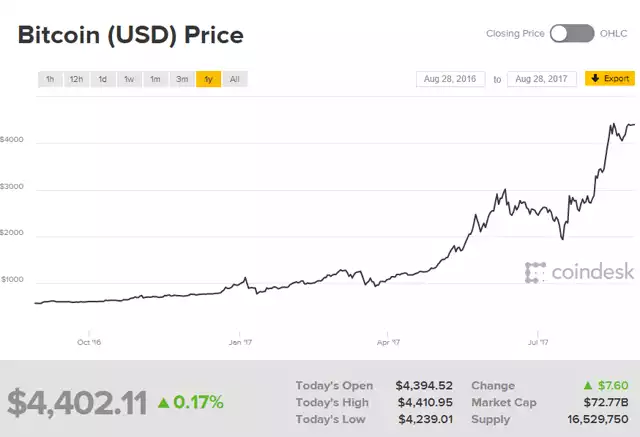
Source: Bitcoin Price Index - Real-time Bitcoin Price Charts
Bitcoin has appreciated from $968.23 on December 31, 2016, to over $4,402 on August 28. The leading digital currency has more than quadrupled in value this year.
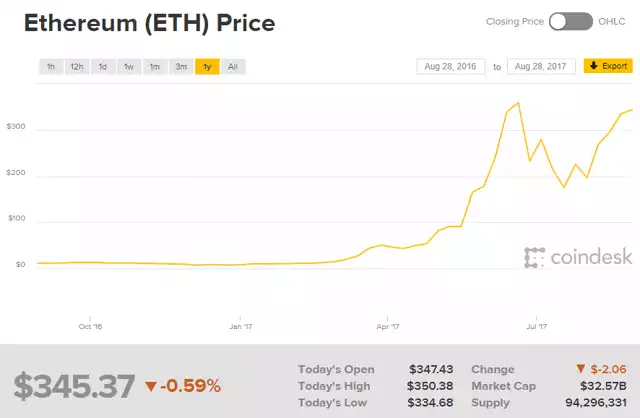
Ethereum Price - CoinDesk
The price of Ethereum has increased by over 43-fold since the end of last year moving from $8 to over $345 as of August 28. These digital currencies have certain characteristics in common with gold. They are means of exchange, and their price paths are outside of the control of the world’s central banks, monetary authorities, and governments. At the same time, equities have moved to new all-time highs over recent weeks. It was about time for gold to make a move after thoughtfully evaluating the state of global markets. Additionally, the geopolitical landscape continues to reflect the potential for fear and uncertainty in the weeks and months ahead. The U.S. relationship with Russia has deteriorated to a post-cold war low, North Korea has become a nuclear power, and the rogue nation has made no secret about threatening the United States. China has tried to play the role as mediator as the tension on the Korean peninsula increases, and trade issues between the U.S. and China continue to present problems for the relationship.
With the dollar moving lower, bonds higher, the geopolitical landscape rife with potential for conflict and other commodities prices moving higher, gold has attracted buying. The yellow metal has broken to the upside in a move that could just be the beginning of a powerful leg that will take the price much higher over the coming weeks and months. The technical picture for the yellow metal is now looking better than it has in a very long time.
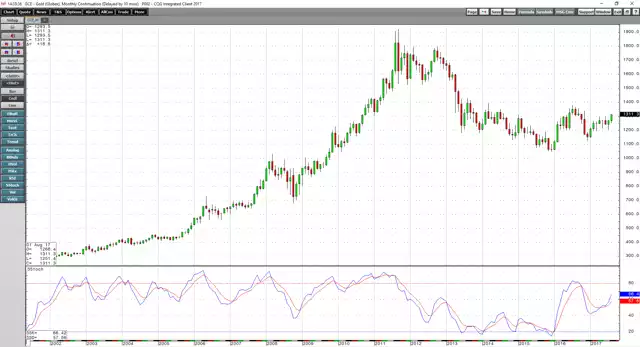
The monthly chart is bullish
Longer-term charts for gold have turned bullish as the price has finally climbed above the $1,300 per ounce level.
Source: CQG
As the monthly chart shows, the slow stochastic which is a momentum indicator crossed to the upside in April, and after a period of consolidation, the metric now points to a rising trend for the price of the yellow metal. If gold can power through the next level of technical resistance at $1,377.50, the next target will become the August 2013 highs at $1,428 per ounce. Above there, it could be off to the races on the upside.
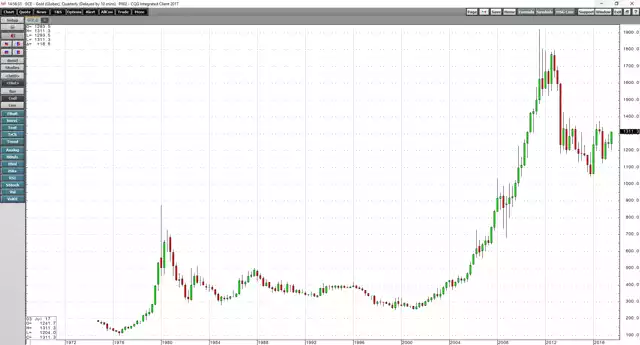
A quarterly key reversal could prove as a launching pad
The weaker dollar, stronger bond market, rallying raw material prices, and economic and geopolitical landscapes have combined to create a perfect storm for the price of gold. On the quarterly chart, a close above last quarter’s highs could ignite the price of the precious metal from a technical perspective.
Source: CQG
As the quarterly chart shows if the price of gold closed at the end of September above $1,295.20 the yellow metal will put in a bullish key reversal trading pattern. Gold traded below the Q2 lows at $1,214.30 during Q3 as it fell to $1,204 on the continuous contract. The Q2 high was at $1,295.20, and a close on the final day of September above that level would provide a significant technical signal for the gold futures market. The last time we witnessed a bullish key reversal trading pattern on the quarterly gold chart was back in the third quarter of 1999 when gold was below $300 per ounce. While it took a few years for the precious metal to explode to the upside, the lows of $252.50 per ounce in Q3 1999 still stand as the bottom dating back to 1979.
Gold broke out to the upside on Monday, August 28, and all of the evidence adds up to a continuation of bullish conditions as gold seems prepared to make its next leg higher over the weeks and months ahead. At the same time, gold is the most liquid metal in the precious metals sector, and a continuation of the rally could prove explosive for the prices of silver, platinum, and palladium.”