Silver “The Cheapest Metal on Earth”
News
|
Posted 30/07/2020
|
16251
Sometimes you just need a quick reminder of one of the key fundamentals rarely spoken about in terms of gold, silver and bitcoin’s potential in an environment such as this. When a Wall Street heavy weight such as Paul Tudor Jones turned so bullish on precious metals and Bitcoin in May, it spread like wildfire in the press. We reported on it here.
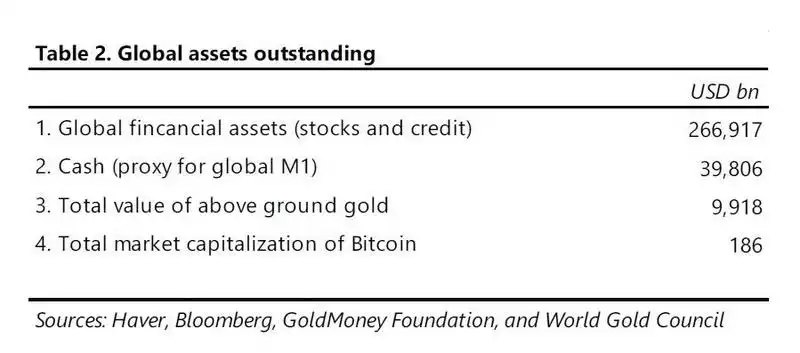
Tudor Jones talks, as we have many times, to the sheer asymmetric size of paper assets versus hard assets. He calculated there is about $300 trillion in paper financial assets compared to nearly $10 trillion in above ground gold and just $0.186 trillion of Bitcoin. We reported earlier this month that there is an estimated $0.087 trillion or $87b (at today’s price) of silver above ground according to the Silver Institute.

As we raised in that linked article there is a massive difference between ‘above ground supplies’ and what is actually investable metal, and particularly for gold what might be investable but not locked away by central banks and indefinitely long term ‘cultural holders’ such as Chinese family offices and the like. Indeed the accepted number is around just $1.5 trillion of gold.
And so the key point to understand is that in the Economics 101 3 parameter equation of price – demand – supply, when even a fraction of that $300 trillion tries to get into that tiny $1.5 trillion space, a space that can’t be expanded with more supply, that leaves just one parameter… price. The tiny silver market takes that to an even more absurdly tantalising equation.
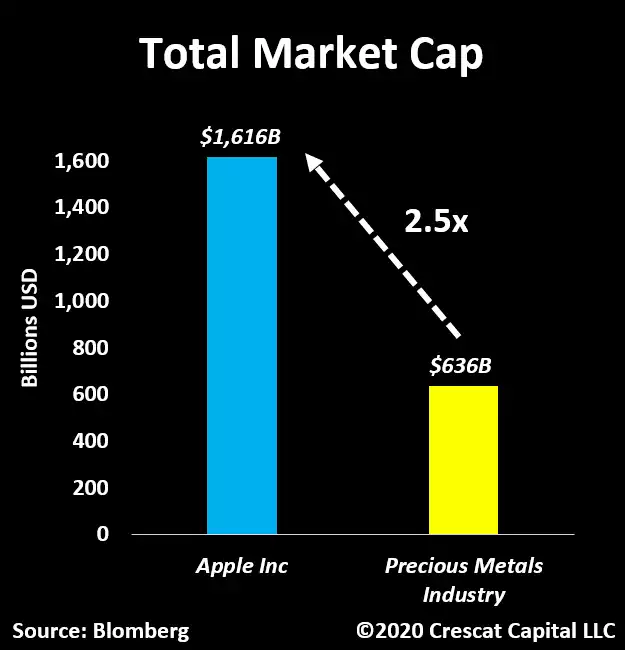
Just to put this further into context consider the following chart from Crescat. Whilst the PM figure is on the ‘business’ side of PM’s not the actual metals, it is just another interesting insight into the disconnect between tech and monetary fundamentals.

The likes of Apple and the rest of the tearaway NASDAQ have been buoyed by unprecedented new money searching for a home amid a recession. Tech, just like a little bubble you might remember at the beginning of this century, is easy to build an “it’s different” narrative around when looking where you might invest in equities. But that same free money is seeing bond yields, in real terms, turn negative as we illustrated in the second chart yesterday and against which gold moves inversely lockstep upwards.
Last night gold rallied again on the latest US Fed meeting where “whatever it takes” was firmly reiterated. In other words the printing presses will continue to go brrrrrr. The market is again now pricing in negative nominal rates (so more deeply negative real rates referred to above) next year.
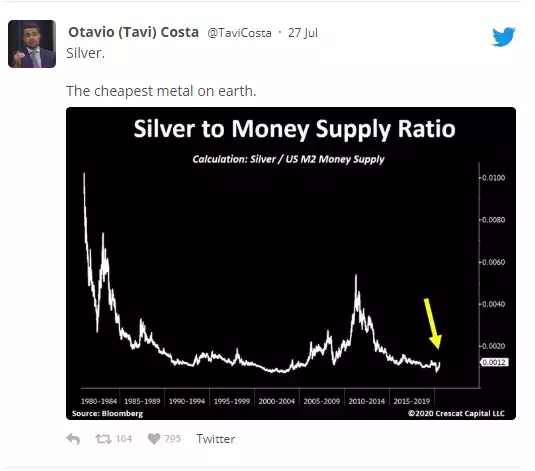
Whilst in simple nominal terms silver looks to be halfway to retracing it’s $48 high in 2011, when you look at it in the context of it being real money compared to that supply of new “money” (USD fiat currency) you can see just how far off we are really in that retracement in the chart and tweet below:
