Mining costs
News
|
Posted 17/04/2014
|
5920
The mining industry doesn’t buy barrels of oil, rather they consume diesel. Let’s look at the price change in diesel since 1998:
1998 Diesel price gallon = $1.04 (U.S.)
2002 Diesel price gallon = $1.31 (U.S.)
2013 Diesel price gallon = $3.92 (U.S.)
Here we can see that diesel spot prices have tripled from 2002-2013 and nearly quadrupled from 1998-2013. As the price of energy increases, it pushes up prices of materials, goods and services substantially on the mining companies’ balance sheets.
And this is only part of the story. The chart below reveals the DOUBLE-WHAMMY:
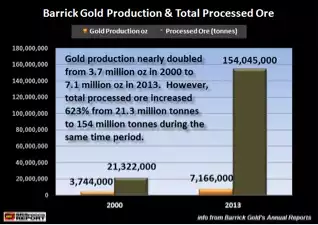
In 2000, Barrick processed 21.3 million tonnes of ore to produce 3.74 million ounces of gold. By 2013, they nearly doubled production to 7.16 million oz, however the amount of processed ore increased a staggering 623%.
Not only have overall input costs skyrocketed since 2000, but the amount of materials and goods consumed per ounce of gold produced increased as ore grades declined.
The current prices of gold and silver are near the break-even level for the mining industry.
This level puts a floor in their prices even though paper trading can induce lower spikes.