Its All about the Fed Liquidity Stupid – Why S&P500 3500 by Year End
News
|
Posted 18/08/2022
|
14402
One of the key lessons post the GFC was ‘don’t fight the Fed’. Many an analyst got caught out concentrating too much on pesky fundamentals and ignored the tsunami of ‘freshly printed’ liquidity unleashed by the Fed and what it would do to share prices amid tepid fundamentals. What ensued was one of the strongest and longest bull markets in history. Fast forward to 2022 and with the Fed going from money printing QE (quantitative easing) to the very opposite in the form of QT (tightening) we are seeing the opposite has been equally true. It’s ALL about liquidity. Real Investment Advice have developed a model to track this and it’s looking at an S&P500 at just 3500 by year’s end in line with the Fed’s forecast. That’s 18% down on its current pricing.
RIA’s model is premised on the 3 main drivers by which the Fed influences liquidity. These are Reverse Repurchase Agreements (RRP or Repo), the Treasury General Account (TGA) and the Fed’s balance sheet. Below is a summary of each and what it is telling us about the world’s largest and most important sharemarket index.
Reverse Repurchase Agreements (RRP)
Simply these are one of the tools the Fed uses to manage the supply of money to maintain its Fed Funds Rate target range (currently 2.25-2.50%). In an RRP transaction, the Fed sells securities (bonds and Treasuries) to a counterparty (usually a bank) and simultaneously agrees to repurchase them at a future date. The duration is often overnight. The transaction temporarily reduces the supply of money from the banking system. Increasing daily RRP balances results in less system liquidity, and a declining balance reduces liquidity.
As we have written ad nauseum, the world has never seen the amount of money printing like that unleashed by the Fed since COVID. Remember for context that over 40% of ALL the ‘money’ EVER printed in the US was printed in 2020. Just let that sink in and ask yourself why this inflation is a ‘shock’. But we digress... Whilst the Fed kept its Funds Rate at zero, that amount of money could easily have taken rates deeply negative if not managed. The chart below shows how hard they had to go with RRP to control the effects of all the new money in the system. If you’re not good with zeros, that is over $2 trillion DAILY…. And so the Fed is removing over $2 trillion per day to keep liquidity down.

Treasury General Account (TGA)
This is essentially the US Governments transaction account. Tax etc in, payments out. You can clearly see below where Trump added those huge fiscal injections.
The Fed doesn’t manage the TGA balances, but the surplus cash balance held at the Fed affects banking system liquidity. Fed liabilities (bank reserves) must equal its assets. Bank reserves are fodder allowing banks to make loans and, by default, print money. When the TGA account increases, bank reserves must fall, reducing banking system liquidity. Conversely, a shrinking TGA account adds reserves and liquidity to the banking system. You can see below that whilst they’ve fallen, they are still elevated.

Fed Balance Sheet
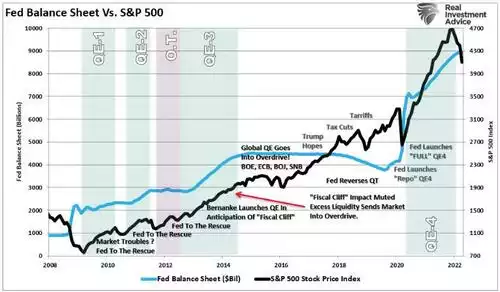
Probably the most talked about and obvious tool is their balance sheet. To print money the Fed buys Treasuries (UST) and Mortgage-Backed Securities (MBS) and provides reserves for the banks to then go and lend against, creating more new ‘money’. And so the bonds sit on their balance sheet as Assets (yes, debt instruments are assets…, no house of cards here, move along) and bank reserves as liabilities to balance things out. And so simply QE directly adds liquidity to the market and the converse arrangement, QT, removes it. We shared the below direct correlation of QE and share prices earlier this week here and discussed it here in the daily Gold & Silver Standard Insights. Have a look at what happened when they briefly tried QT in 2019…
However the balance sheet is but one Fed liquidity influence and RIA have developed the following Fed liquidity model. “The size of the Fed’s assets less the sum of the TGA and RRP equals the amount of Fed-generated liquidity in the system. Recent changes in net liquidity shed light on how the S&P 500 trends.
The two graphs below compare the liquidity measure and the S&P 500. The first graph shows how the S&P 500 rose in line with liquidity through 2021, and both reversed simultaneously to start 2022. The dotted lines are quarterly moving averages to help smooth out the data. The moving averages track each other almost perfectly this year. The green dashed line forecasts liquidity based solely on the Fed’s plan to reduce its balance sheet by $95 billion a month. The S&P 500 could be close to 3500 by year-end if they follow through with their QT plans and the correlation holds up.”

They summarise as follows:
“The Fed is not the only game in town, but they are the biggest game in town. While many other factors account for stock price performance, liquidity may be the most important to grasp.
To drive home this point, recall March 2020, when covid struck the economy. Global economies were shutting down worldwide. Unemployment was soaring, and the economy was careening toward a depression. Despite zero clarity on the economic future, stocks began to rally strongly in late March. Why? Liquidity via fiscal stimulus and a surge in Fed QE purchases drove markets higher. The economic situation was awful, and earnings outlooks were crumbling, but liquidity trumped fundamentals.
By accepting what the Fed does, right or wrong, and closely following its actions, we can quantify how liquidity will steer markets. On top of fundamental and technical analysis, this additional layer of research helps us better navigate the market’s twists, turns, and trends when the Fed is active.”
And so whilst you may think we write about the Fed a lot, there is a clear reason. And, yes it is US based, but the US sneeze > Australia cold analogy still holds strong. The trillion dollar question remains on whether they go all the way or pivot. “Ya’ feelin’ lucky punk?”
************************************************************************************
GOT A QUESTION about today's news?
This afternoon, the Gold & Silver Standard Insights team will be breaking down the news and answering YOUR questions.
Submit your question to insights@goldsilverstandard.com and SUBSCRIBE to the YouTube Channel to be notified when the GSS Insights video is live.
**********************************************************************************