Gold & Silver – Now v Pre GFC v Dot.com
News
|
Posted 28/08/2018
|
14986
Those of you who were invested in or observing the gold and silver markets over the GFC know that at the onset of the crisis gold and silver fell along with everything else. That is not uncommon as the liquidity squeeze resulting from a crash, and in itself exacerbating the crash, sees all range of assets sold to get cash for margin calls and the like.
The difference is that gold in particular went on to rebound very strongly (doubled) while shares continued to fall (halved). As we get closer to the next crash what will gold and silver do then?
One school of though is that difference this time is precious metals are coming off a low as they did in the 2001 crash, whereas in 2008 they were at the top of a big 7 year bull run. The measure often applied in assessing such things is the ratio of the metal against the Dow Jones index. So let’s look at these:
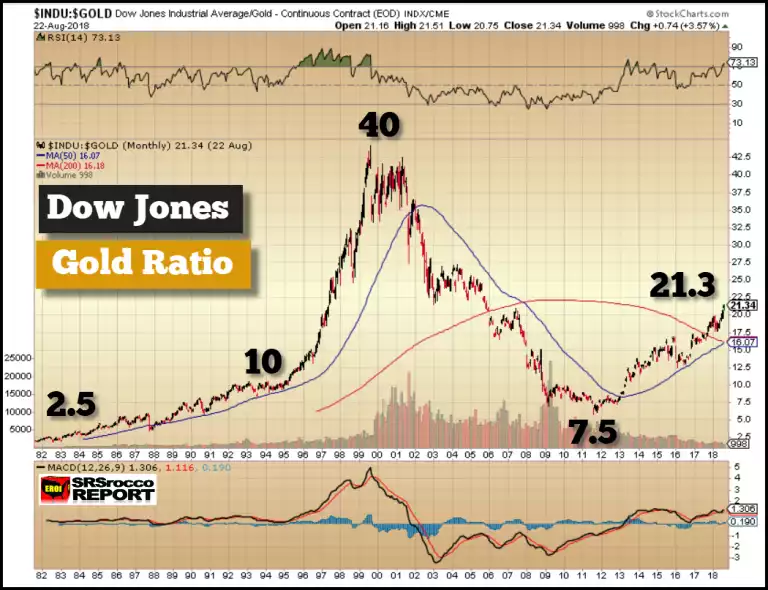
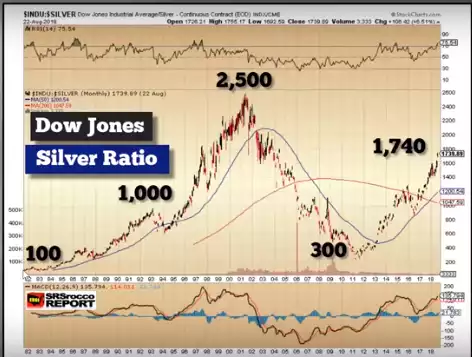
As you can see above we have, again, very elevated dow-gold and dow-silver ratios, above that of prior to the GFC (well above for silver as the gold silver ratio sits at 80:1) and on the move as the 50DMA (blue line) crosses the 200DMA (red line). You can see too down the bottom that the MACD (Moving Average Convergence Divergence) is more overbought now than it has been since the dot.com bubble coinciding with the end of the last secular gold bear market.
The setup is therefore quite extraordinary, and as good as gold and silver ended up being in the GFC, this next one looks set to rival even the 2001 to 2011 bull run that saw gold (in AUD) up 260% and silver up 470%.