Gold’s Golden Cross
News
|
Posted 02/03/2016
|
6721
As evidenced by the gold price action this year (up nearly 19%), we have seen a flight of funds into the safe haven amid growing fears and plunges in financial markets.
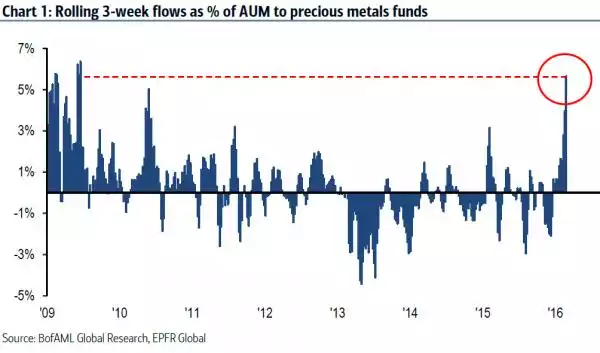
The first graph below shows inflows into gold funds on a 3 week rolling basis. What you are looking at is the biggest inflows since June 2009 (amid the GFC). That flight of funds saw $2.7b leave shares and $2.6b enter gold in just one week, $5.8b over the 3 weeks.
Such demand broke through the other downward pressures on gold (COMEX shorting by commercial banks) and saw the occurrence of the financial milestone, the “Golden Cross” whereby the 50DMA (daily moving average) crosses the 200DMA as can be seen in the chart below.
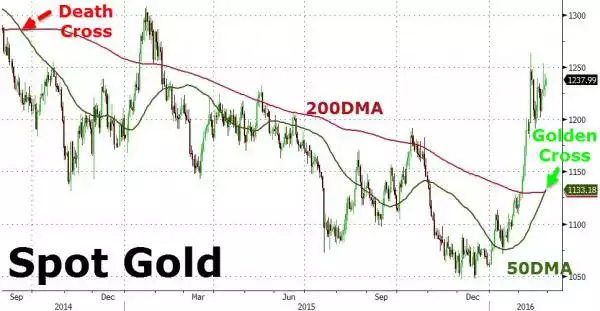
The last time we saw the coinciding of such gold fund inflows and a golden cross was in February 2009 with gold in the mid $800’s. That saw the start of a 120% bull rally.