Gold’s Cup & Handle and $10,000 target
News
|
Posted 10/01/2022
|
9561
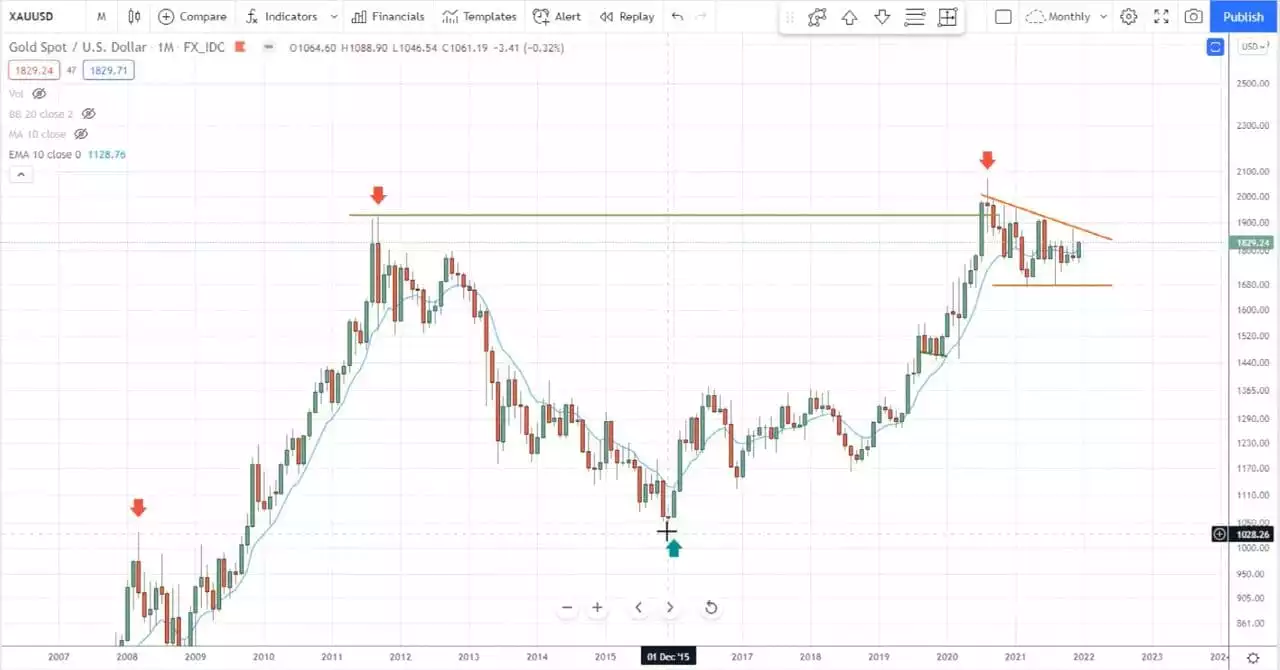
As alluded to in our annual wrap up last year, the technical cup and handle formation for gold is clear, with a number of prominent market commentators pointing to it.
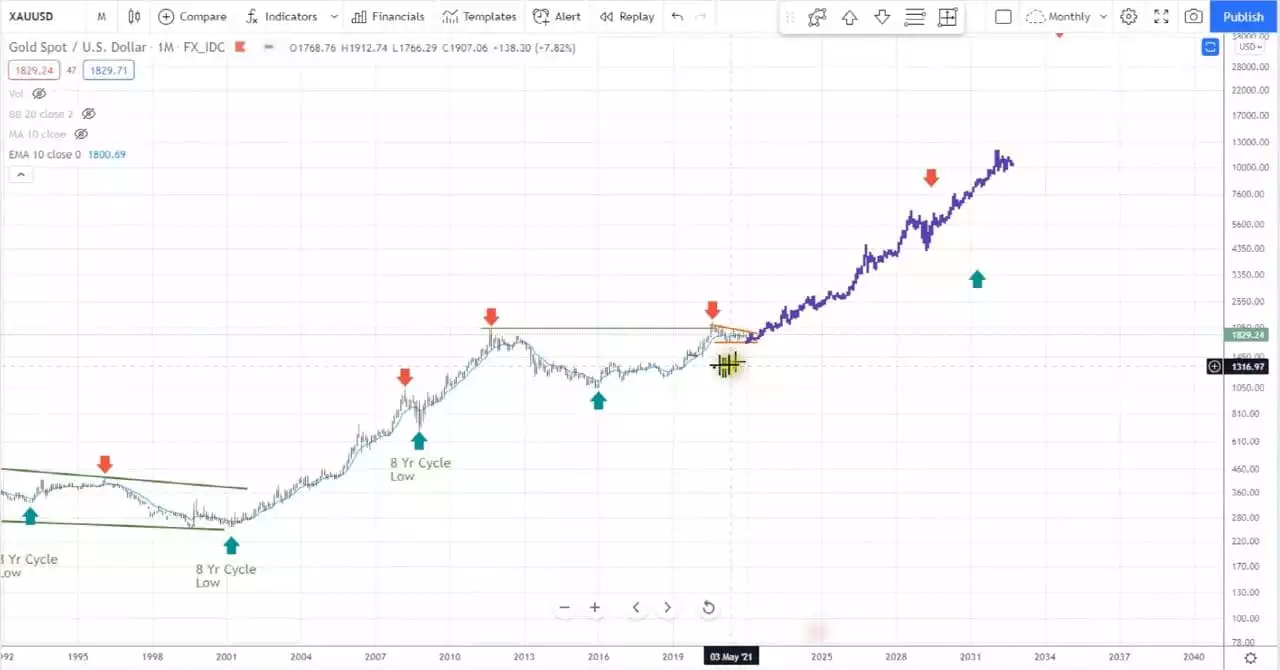
Famed technical analyst Bob Loukas also talked to this formation in his 2 January update, first below showing the current setup for gold and then extrapolating what happened last time we had this formation:


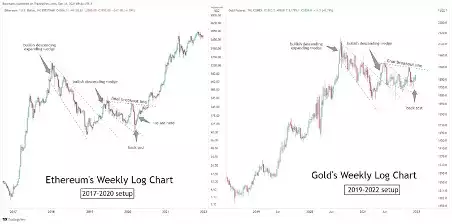
Patrick Karim has drawn parallels with Ethereum from 2017 to 2020 ($180 - $4,200 - log chart)

“We’ve had the semi-blowoff top from August 2020, we’ve had consolidation, a back test, and now we may well see the next leg up.”
There is no certainty of repetition in charts but when one steps back and considers the macro factors at play and indeed the ‘macro macro’ factors outlined in Friday’s must read article, such a consolidation of ‘disbelief’ currently playing out could easily precede the sort of multi year price break out on ‘reality’ coming home to roost and the rush to real assets such as gold and silver that would ensue.