Dow Jones Topped and Set for Long Fall – SCPA 100% Probability
News
|
Posted 07/09/2020
|
12488
Falls on Wall St on Thursday and Friday have analysts speculating as to whether this is the end of the bull trap bounce. It is a public holiday tonight in the US so we will have to wait a bit longer, so let’s have a look at where we might be in an historical sense.
Since 2001, Michael Markowski has headed research for StockDiagnostics.com developing predictive algorithms. He is best known for his SCPA (Statistical Crash Probability Analyses) based on learnings on every crash since 1901. His predictions for the crash in March date back to 2018 with incredible accuracy (remembering the US format of MM/DD/YY):

Via Real Investment Advice he is now calling the peak for the Dow Jones now or soon and then a steady decline to new lows later this year or 2021. The algorithm is returning a 90% probability the Dow will plug a new low before the recession ends, the timing of which will be at least March 2021.
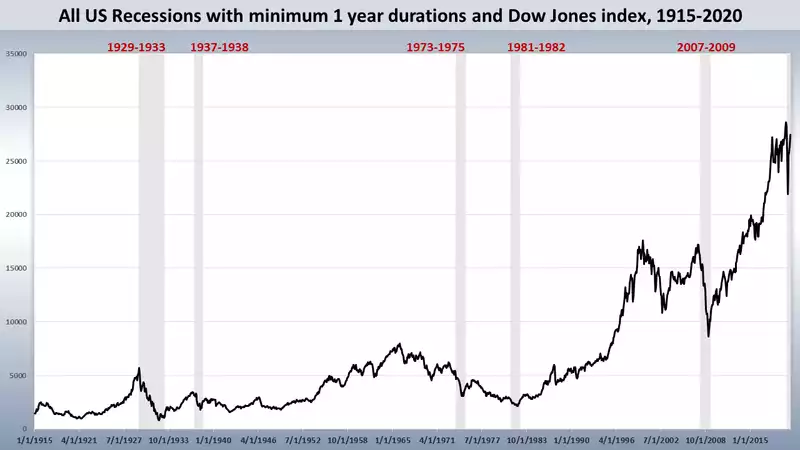
Addressing the V shaped recovery calls, looking at each of the last 5 US recessions, each lasted over a year.

“The research findings revealed that the Dow:
- initially declined after each of the five recessions began
- rallied to interim highs within five to seven months after the recessions had begun
- fell to new recession lows after reaching the temporary highs”

Getting back to our opening question, ‘was last Thursday the top?’, the algorithm is 100% that yes, around now should be the top. The next question is how low will it go and the length of the recession is instructive for that answer. If this recession lasts more than a year than the probability is 90% that we will see new lows for the Dow. The probability for this to extend more than a year is 99% based on research he relies on from the Big 4 firm of Deloittes. Deloittes analysed data over the same period and looked at the determinants of unemployment rate, consumer spending, corporate profits, and personal saving v income. They concluded there would not be a V Shaped recovery and listed unemployment and the savings rate as the two biggest ‘headwinds’ facing the US recovery.
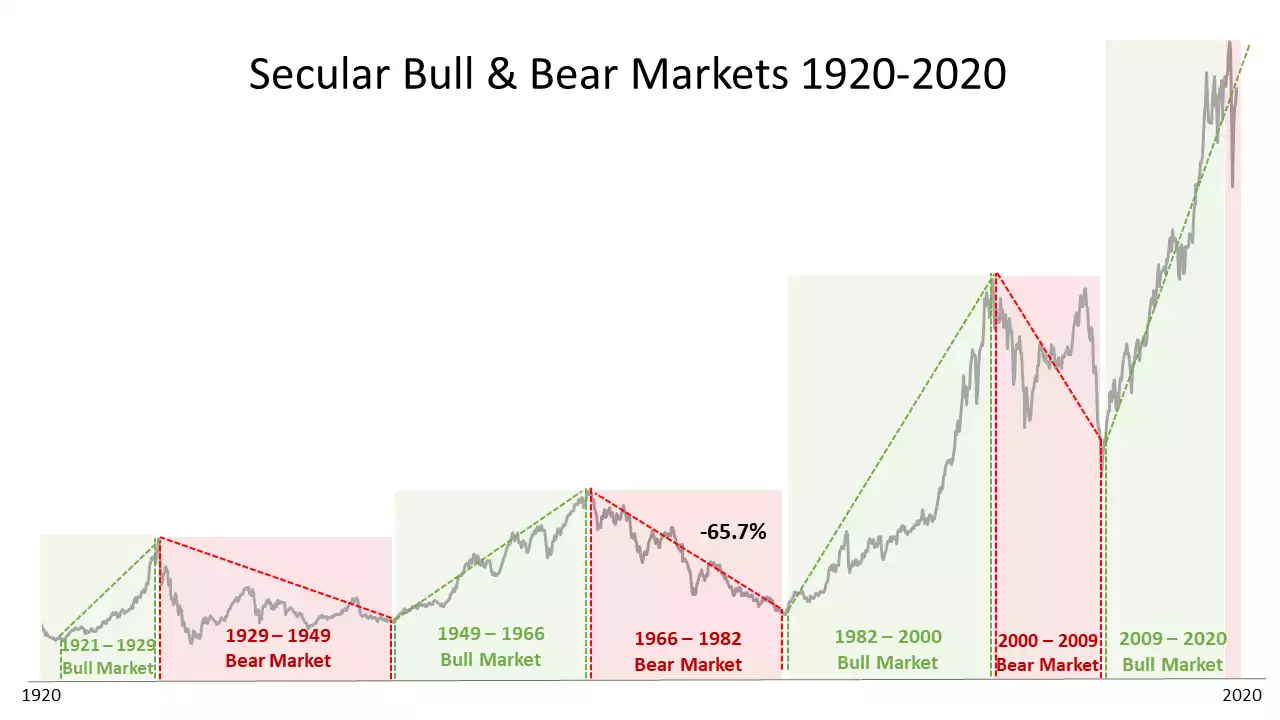
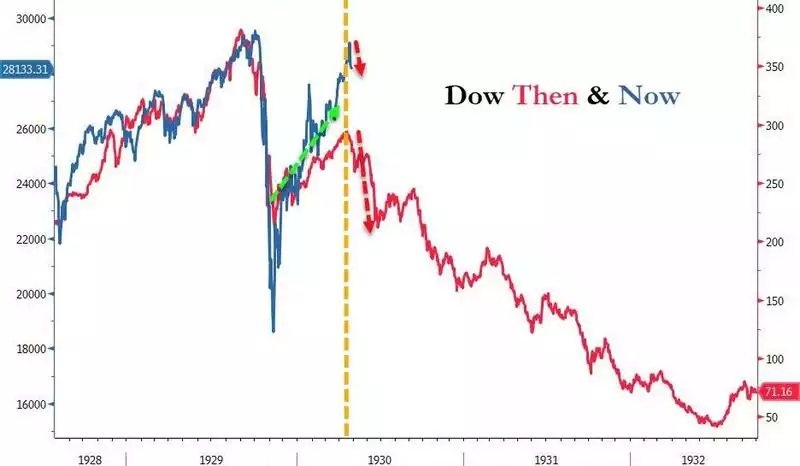
Putting this all into perspective, the first chart below shows where we are at and the second shows historically where we could go. This all coincides with news last week of huge selling volumes from ‘insiders’ (company execs who know the real story). The interpolation is ultimately up to you.

