Dow Gold Ratio Turning Point?
News
|
Posted 12/05/2016
|
5256
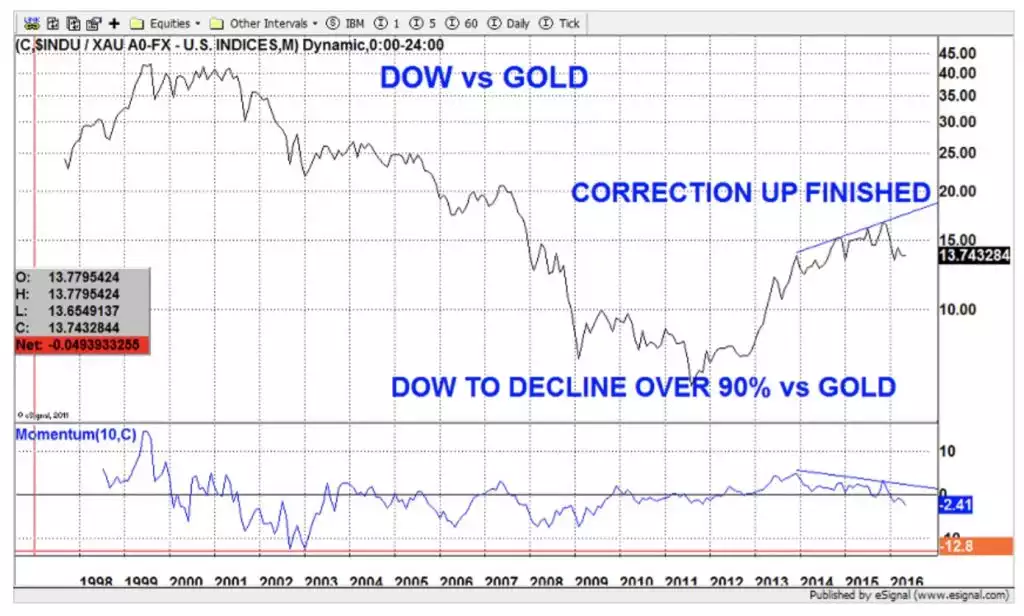
There is a quote and chart from Egon von Greyerz (Founder and Managing Partner of Matterhorn Asset Management AG) doing the internet rounds now as follows:
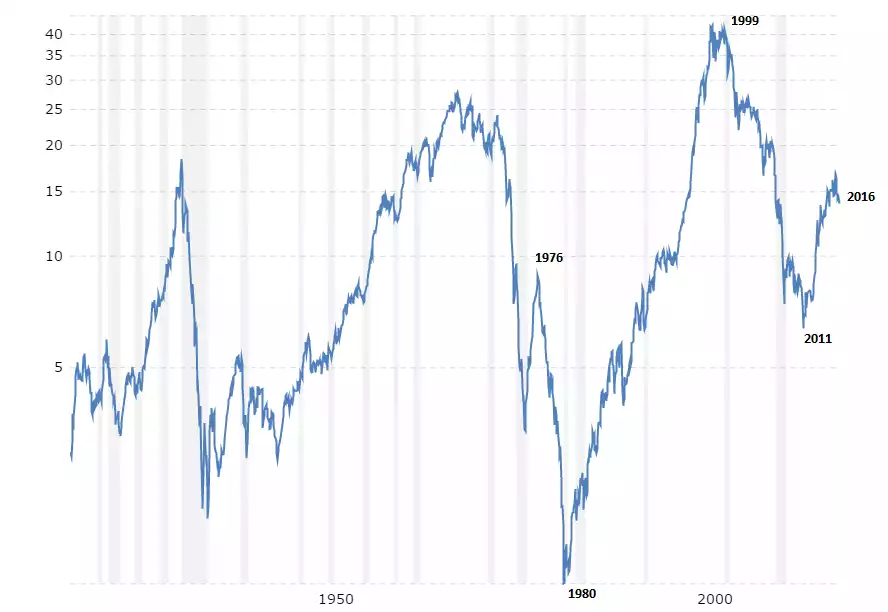
"I have previously talked about the importance of the Dow Gold ratio. This ratio peaked in 1999 when the Dow was at a high and Gold at the $250 low. The ratio then declined by 87% until September 2011. This means that the average investor in the US stock market was a massive 87% worse off compared to owning gold instead. Between 2011 and the end of 2015, the ratio recovered 25% of the fall since 1999. Technically it is very clear that the dead cat bounce in this ratio is now finished and that it is on the way to new lows. Since December last year the Dow has fallen 18% against gold. Eventually I see the ratio going well below the 1 to 1 ratio in 1999 [we think he means 1976?] (Dow 800 and Gold $800). But even if the ratio only went to 1 that would mean a fall of the Dow versus gold of 92% from here. So gold in the next few years will not only preserve investors wealth but also enhance it. Holding stocks on the other hand will not only lead total despair but also to total wealth destruction."
It is probably clearer we think to look at 50 years of the Dow Gold Ratio per the chart below we’ve taken from Macrotrends.net charting site. Note the clear inference of Egon that, just like the gold price trending in general, it looks and feels a lot like 1976 right now, i.e the end of a ‘dead cat bounce’ before the real drop.