Deflation to Inflation & Gold
News
|
Posted 30/09/2020
|
10565
The building pressure on governments to unleash fiscal spending in the face of not just the deflationary effects of the pandemic but also of technology, demographics and debt is enormous. Amid all the talk of inflation now, this is missing the seemingly unavoidable deflationary period that precedes, and indeed the reaction to which, causes it.
The pandemic has obviously had huge deflationary effects given the forced slowing of demand and lower wages. Topically, last night we saw the European situation get even worse with their biggest economy, Germany, posting a 5 year ‘high’ deflation figure of -0.4%. Technology is introducing efficiencies that reduce human labour at an incredible pace and in so doing deflating real wages and making many goods and services cheaper. Our aging population, many without sufficient savings and a work force to retiree ratio dropping by a massive margin, adds to these effects. That is building an enormous future liability of deficit funded social support. The burden of debt is also deflationary as more and more money goes to service it let alone try and pay it down. And as Raoul Pal says – Debt + Deflation = Insolvency. Pure and simple. It’s why governments will do all they can to avoid it.
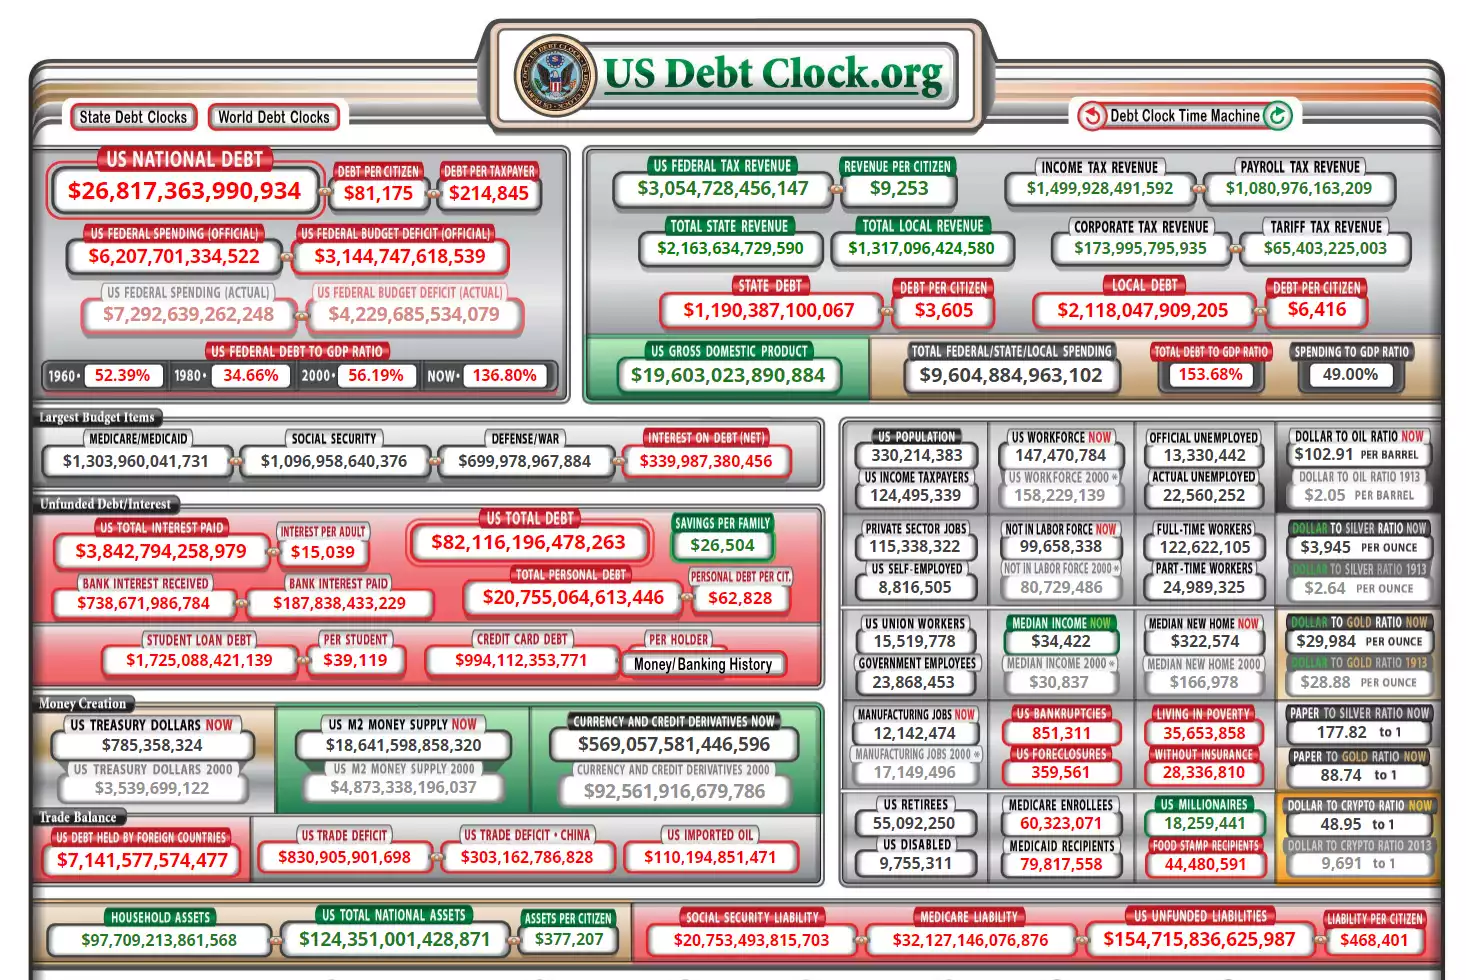
Below is a screen shot of the current US debt situation. You can check this out any time at usdebtclock.org.

As Jim Rickards recently wrote:
“We’re seeing more deficit spending in 2020 than the past several years combined. The government will add more to the national debt this year than all presidents combined from George Washington to Bill Clinton.
This spending explosion comes on top of a baseline budget deficit of $1 trillion. Combining the baseline deficit, the approved spending and the expected additional spending brings the total deficit for 2020 to over $3 trillion at the minimum.
That added debt will increase the U.S. debt-to-GDP ratio to over 120%. That’s the highest in U.S. history and puts the U.S. in the same super-debtor’s league as Japan, Greece, Italy and Lebanon.”
However whilst most focus is on that $26.8 trillion figure, what is too often forgotten is the massive amount of unfunded liabilities sitting in the bottom right hand corner in the figure above. $154.7 trillion of real future liabilities that will not go away are simply not ‘on the books’ like any company would have to do under GAAP. That is where all these retirees come into play. They do not have sufficient savings and they are increasingly reliant on medicare. These are very real future costs simply not accounted for.
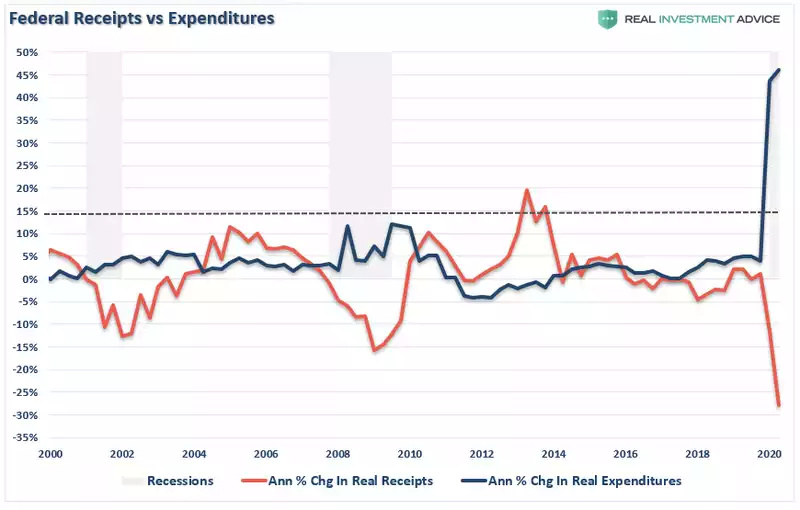
More broadly and immediately, in the US, such has been the collapse in tax revenue and spike in social welfare that (from Real Investment Advice) “It now requires over 100% of Federal tax receipts to meet the mandatory spending of social welfare and interest on the debt. In other words, we are now going into debt more to provide social assistance.”

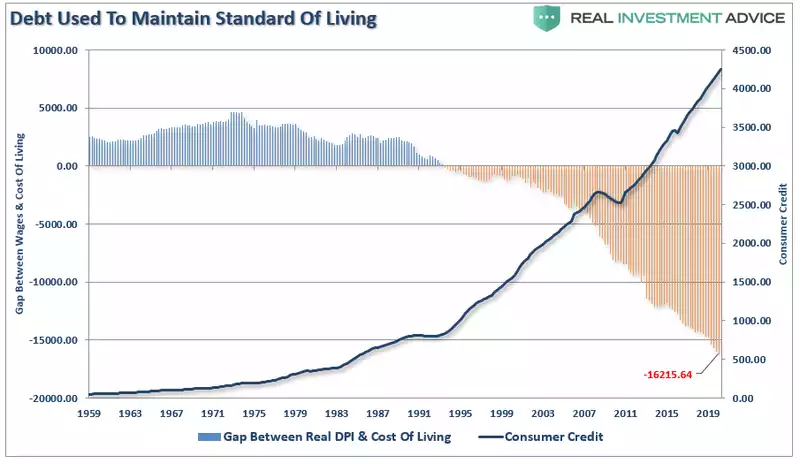
However this is not a pandemic only issue. The deflation of wages and the rising cost of living has seen the rise of debt funded maintenance of living standard rise since, you guessed it again, 1971 when we left the gold standard and started this epic debt cycle.

Central banks around the world, including our own RBA are screaming out to their respective governments to unleash fiscal spending. Whilst the RBA is widely tipped to cut our already all time low rates of 0.25% to just 0.1% next month, the reality is that will do little to help. That is why Phillip Low is imploring ScoMo to print more money and ramp up spending. ScoMo is reluctant and in the US, whilst both sides want to, indeed with the Democrats latest packaging amounting to an incredible $2.2 trillion, they are locked in impasse. The solution is not simple.
We then have 2 schools of thought. In the absence of choice, governments react to deflation in the only way they know how… print more money. Giving up on Central Banks, they do so directly, be that MMT or otherwise. That inevitably ends in hyperinflation.
Continuing on from his quote above, Jim Rickards sees the Japanification of the US as follows:
“That added debt will increase the U.S. debt-to-GDP ratio to over 120%. That’s the highest in U.S. history and puts the U.S. in the same super-debtor’s league as Japan, Greece, Italy and Lebanon.
The idea that deficit spending can stimulate an otherwise stalled economy dates to John Maynard Keynes and his classic work The General Theory of Employment, Interest and Money (1936).
Keynes’ idea was straightforward.
He said that each dollar of government spending could produce more than $1 of growth. When the government spent money (or gave it away), the recipient would spend it on goods or services. Those providers of goods and services would, in turn, pay their wholesalers and suppliers.
This would increase the velocity of money.
Depending on the exact economic conditions, it might be possible to generate $1.30 of nominal GDP for each $1.00 of deficit spending. This was the famous Keynesian multiplier. To some extent, the deficit would pay for itself in increased output and increased tax revenues.
Here’s the problem:
There is strong evidence that the Keynesian multiplier does not exist when debt levels are already too high. In fact, America and the world are inching closer to what economists Carmen Reinhart and Ken Rogoff describe as an indeterminate yet real point where an ever-increasing debt burden triggers creditor revulsion, forcing a debtor nation into austerity, outright default or sky-high interest rates.
Reinhart and Rogoff’s research reveals that a 90% debt-to-GDP ratio or higher is not just more of the same debt stimulus. Rather it’s what physicists call a critical threshold.
The first effect is the Keynesian multiplier falls below 1. A dollar of debt and spending produces less than a dollar of growth. Creditors grow anxious while continuing to buy more debt in a vain hope that policymakers reverse course or growth spontaneously emerges to lower the ratio.
This doesn’t happen. Society is addicted to debt, and the addiction consumes the addict.
The endpoint is a rapid collapse of confidence in U.S. debt and the U.S. dollar. This means higher interest rates to attract investor dollars to continue financing the deficits. Of course, higher interest rates mean larger deficits, which makes the debt situation worse. Or the Fed could monetize the debt, yet that’s just another path to lost confidence.
The result is another 20 years of slow growth, austerity, financial repression (where interest rates are held below the rate of inflation to gradually extinguish the real value of debt) and an expanding wealth gap.
The next two decades of U.S. growth would look like the last two decades in Japan. Not a collapse, just a slow, prolonged stagnation. This is the economic reality we are facing.
And neither monetary policy nor fiscal policy will change that.”
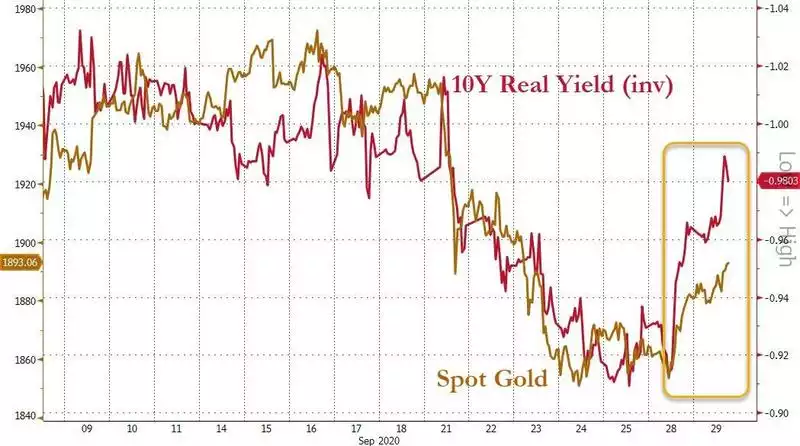
Gold thrives in this situation as when real rates are negative (inflation higher than interest rates) gold shines. It is hard money when invested fiat money is literally going backwards. Gold’s rally back above $1900 yesterday was simply following that trend:

However in a deflationary environment, where the prospect of positive real rates despite zero or negative interest rates becomes a reality, the one and only response of governments to print money at an unprecedented and direct manner sees money run to gold again as that only ever ends one way… out of control inflation.