Debt to GDP around the world
News
|
Posted 30/01/2015
|
5393
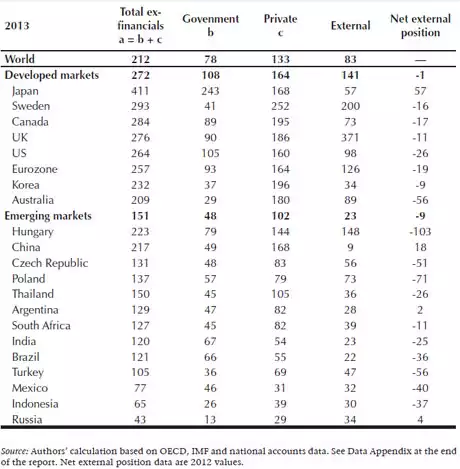
The table below should strike fear into anyone with a basic mathematical ability and school level finance. It is a table illustrating the percentage of debt, both Government and Private, against GDP (income). Since we left the gold standard in 1971 there has been no restraint on the accumulation of debt. Governments have run continual deficits and businesses and individuals have bolstered the party through debt fuelled consumerism and the belief we will always have growth and inflation. As things slow like we are seeing now around the world, such debt is becoming of greater and greater concern. All the money printing in the world may not be able to ‘fix’ it, and indeed will make it worse. Whilst opposition to the Australian government trying to rein this in is based on our Government ratio being “only” 29%, you will note our total is bang on the developed world average – a pretty nasty 212%. The new global interconnectedness makes the likes of Japan and Hungary (whose large external debt has a big chunk in, now newly revalued, Swiss francs…) everyone’s problem anyway…