WGC Q1 Gold Demand Trends 2020
News
|
Posted 01/05/2020
|
19284
Yesterday saw the World Gold Council’s quarterly demand trend report drop and as always we summarise for you.
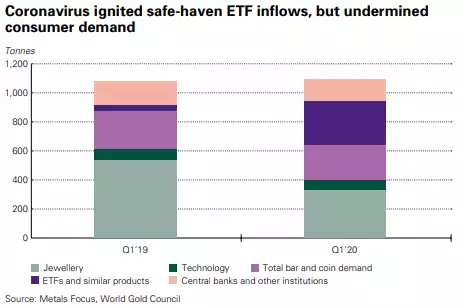
Q1 of 2020 was a tale of one predominant impact and two disparate results. Q1 of course saw the start of the COVID-19 virus which on one hand saw a surge in investment demand but on the other saw jewellery demand plummet. On a net basis it saw just 1% year on year growth to 1,083.8 tonne. Let’s unpack the report.
Jewellery
- COVID-19 induced tightening and the effects of soaring gold prices saw jewellery demand plummet 39% to 325.8 tonne, a record low.
- China , the largest jewellery market, was hardest hit by lockdown measures in Q1 – demand was slashed by 65% y-o-y to 64 tonne, the lowest in 13 years. Likewise India dropped 41% to 73.9 tonne, its lowest in 11 years, during the GFC.

Investment
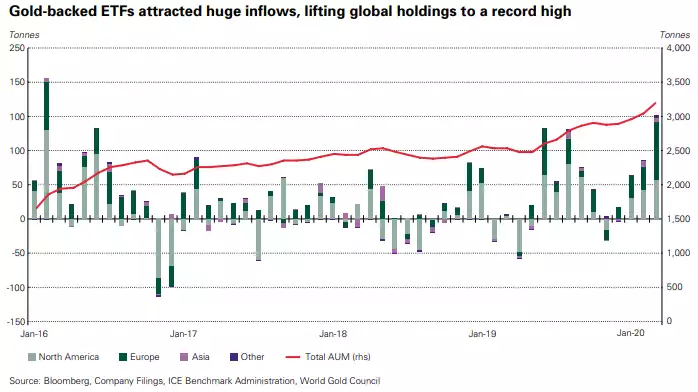
- Inflows into gold-backed ETFs surged in Q1, coin investment jumped, offsetting weaker bar demand
- Global holdings of physically-backed gold ETFs (gold ETFs) and similar products jumped by 298t during Q1 – the highest quarterly inflows for four years. In value terms, assets under management (AUM) in these products increased by a record US$23bn over the quarter on the back of a 10% increase in flows combined with a 6% quarterly increase in the gold price. Holdings reached a new historical high of 3,185t by the end of the quarter.
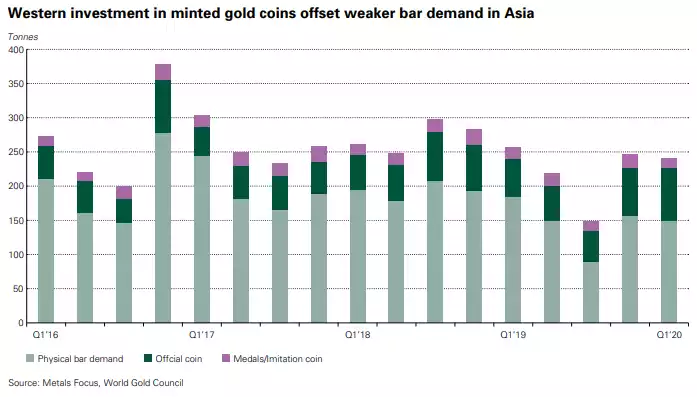
- Curiously bar and coin demand saw a reverse of the east v west dynamic in play for so long. The more coin oriented western market (particularly the US) saw a surge in demand seeing coin demand up 36% to a 3 year high 76.9 tonne, whilst the Asian market, favouring bars, saw a 19% drop to 150.4 tonne. China was the main culprit, down 48% to 39.3 tonne as it saw lockdown for most of the quarter. Encouragingly that started to rebound on easing but it was right at the end of the quarter and hence little impact on Q1 figures. The net result for the collective coins bar and coin demand was a 6% drop to 227.3 tonne.
Technology
- As with jewellery, the COVID-19 lockdown impacted the technology-centric industrial use of gold as well. Overall, demand in the technology sector fell 8% y-o-y to 73.4t – the lowest figure in their quarterly historical series.
- The electronics sector recorded a fall in demand, dropping 7% y-o-y to 59t
- Gold used in other technology applications was 13% lower y-o-y at 11.2t during the quarter, and dental demand continued its decline with a 9% y-o-y fall to just 3.2t.

Central Banks
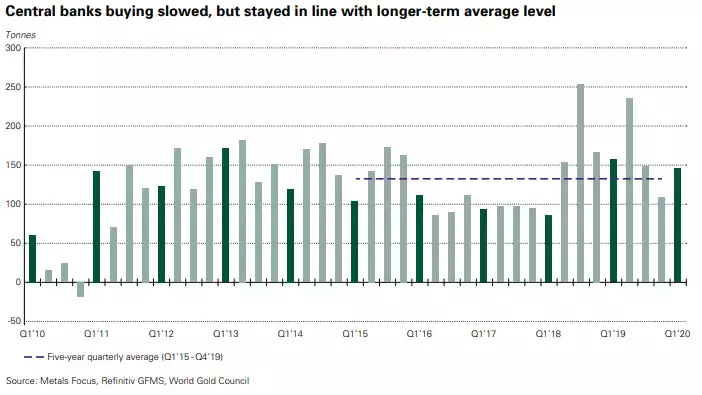
- Central bank remained net buyers of gold with net purchases totalling 145t in Q1, 8% lower y-o-y though 9% above the five-year quarterly average of 132.9t.
- 6 central banks made net purchases of a tonne or more, compared with 10 over the same period last year
- Russia announced that after Q1 it will suspend its gold purchases having bought more than 1,900t since 2005. (As we know now in Q2 that didn’t last long with their sizeable recommencement in April)
Supply
- Significant disruption caused by the coronavirus pandemic saw total supply fall 4% y-o-y to 1,066t in Q1. This is the lowest level of quarterly gold supply since Q2 2013.
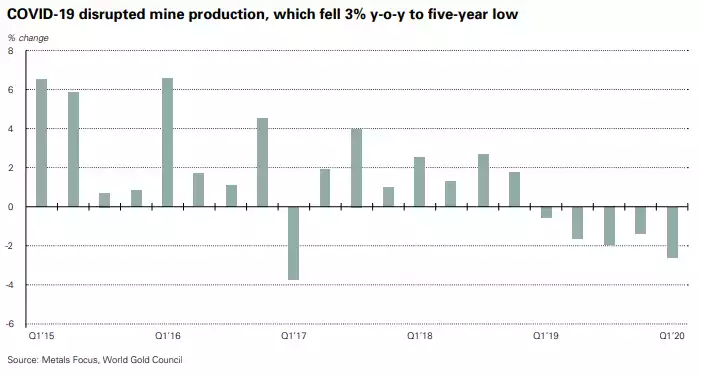
- Mine production dropped 3% y-o-y in Q1, hampered by the coronavirus pandemic
- Coronavirus disruption will likely impact full year gold supply
- Despite higher prices, recycled gold fell 4% to 280t in Q1.

- In Q1, provisional data indicates that mine production was 3% lower y-o-y at 795.8t. This is the lowest level of Q1 mine production since 2015, and the largest y-o-y decline since Q1 2017. It also marks the fifth consecutive quarter of y-o-y declines.
