Buying the Dip v Free Cash
News
|
Posted 13/06/2017
|
7443
Markets continued their wobbles last night with the NASDAQ taking another hit, falling another 1.4% before some buying of the dip saw it claw back to being down 0.5%, but down a chunky 2.3% for the last 2 days of trade. Today’s headlines of “Tech Wreck” seem a little premature but a telling shake up nonetheless.
The dip buy (affectionately acronym’d BTFD these days) is an interesting point of discussion now as strong dip buys imply there is ‘cash on the sidelines’ ready to be deployed to any market correction and thereby reducing the risk of a full blown crash. In a piece published by the Financial Analysts Journal, Clifford S. Asness points out the contradiction in the ‘cash on the sidelines’ theory:
“There are no sidelines. Those saying this seem to envision a seller of stocks moving her money to cash and awaiting a chance to return. But they always ignore that this seller sold to somebody, who presumably moved a precisely equal amount of cash off the sidelines.”
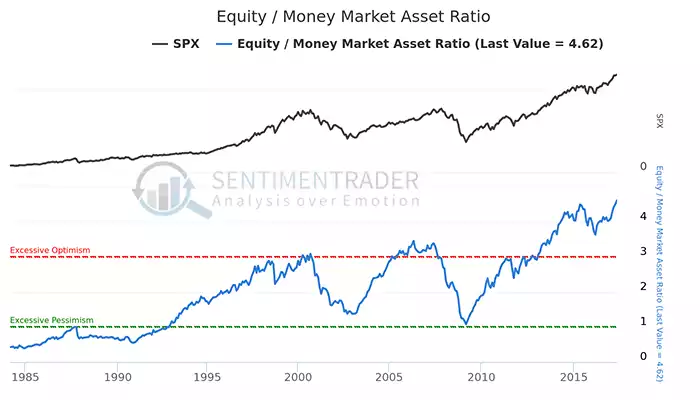
An article last week titled “Liquidity Drain” by Real Investment Advice’s Lance Roberts shows that in the big mutual funds at least there is definitely little ‘cash’ as the graph below illustrates the ratio of funds deployed into equities compared to money markets (in effect their ‘cash’ play). You will note they have never been more “all in” than now, ever.
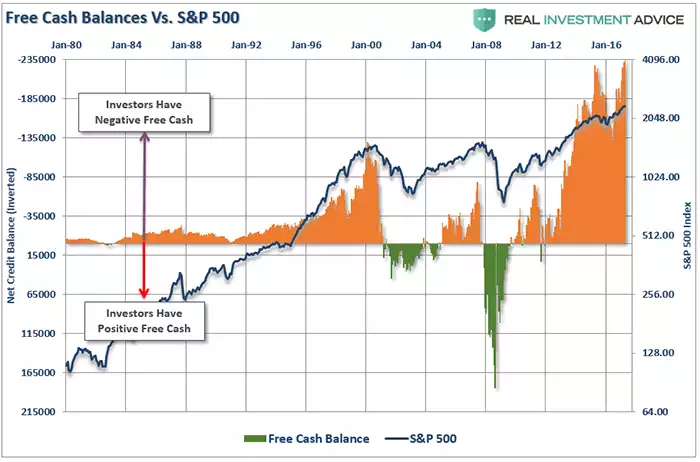
Indeed not only is there little ‘cash’ on the sidelines in mutual funds, but investors collectively are NEGATIVE cash – yep, that’s debt – to the highest extent ever (there’s that ‘ever’ word again – is it different this time?). Debt is the way to get around that pesky theory of Asness’s. And hey, what could possibly go wrong yeah?
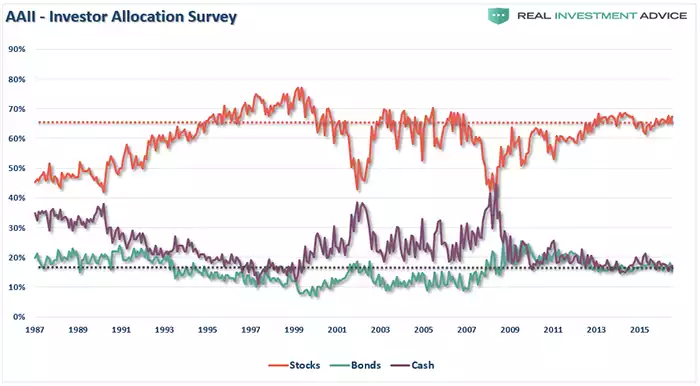
Finally, Roberts produces the following chart showing again the near record low allocations to cash and bonds compared to shares:
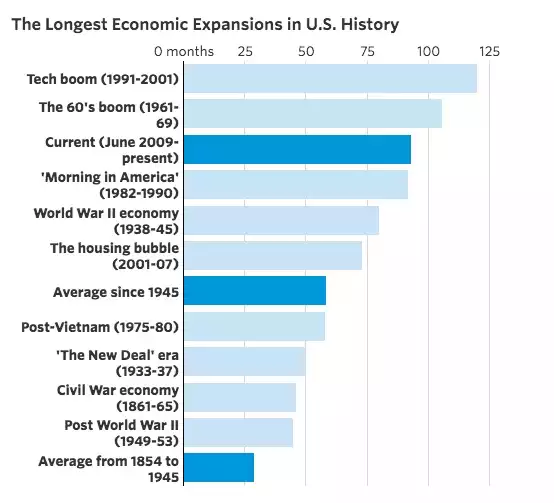
When looking at the charts above you can see the monster in waiting that the tech boom (1991-2001) was. The NASDAQ dropped nearly 80% on that one. The question’s are – was this 2.3% drop on the NASDAQ an early indicator of what is to come? Will the ‘cash on the sidelines’ buy-the-dip and take it to new highs? Is any cash on the sidelines waiting for a much bigger crash? No one knows. Certainly the chart below indicates this could possibly go for some months yet… Our current “Everything Bubble” is currently smack bang between the Tech Boom (dot.com) and the Housing Bubble (GFC). Are you ready?