Bullion Demand Falls – or Did It?
News
|
Posted 23/03/2017
|
4314
There has been a little alternative press lately about the drop in physical demand for gold and silver. That seems a bit at odds with the price movement but it is missing 2 essential factors. One, it ignores Chinese demand, and secondly it ignores gold bought to back the ‘paper’ gold ETF trades.
But it does appear to be correct from a bullion sales in the west perspective (to the end of February) and gels with our experience at Ainslie Bullion over that period. The following chart however puts a few ‘barometers’ of western demand (i.e. US Mint coin and Perth Mint sales) over that period (versus the same last year) against the well regarded proxy for TOTAL Chinese demand (in via Hong Kong and Shanghai) of the Shanghai Gold Exchange withdrawals. PS…. Watch out for our Sunday morning email for more on this.
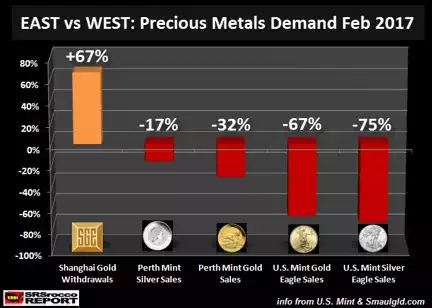
Percentages only tell half the story too. That Chinese demand was 179 tonnes of gold, a record for that month. To put that into perspective that equates to two-thirds of global gold monthly mine supply. February 2016 saw 107.6 tonne by comparison, a 71.6 tonne increase this year or 2.3m oz. To put that into further perspective the above decreases in US Mint and Perth Mint gold sales total around just 67,806oz, a fraction of 2.3m.
Secondly, in last week’s Weekly Wrap, we reported the “World Gold Council released their end of February figures showing total holdings in gold-backed ETFs and the like rose 4% or 90.6 tonne to 2,246.1t from January and the value of $90.7bn was up 8% with the strengthening price.”
So what is the takeaway? Well for a start the data is to the end of February and doesn’t capture the risk off sentiment that entered the market this week. But moreover we are reminded of Warren Buffett’s famous quote:
“Be Fearful When Others Are Greedy and Greedy When Others Are Fearful”