BTC Finding Support at All-Time Highs
News
|
Posted 16/11/2021
|
6250
The Bitcoin market pushed to yet another ATH last week, peaking at $68,742 US, before pulling back to a low of $62,401. The market is currently consolidating, having held onto the majority of the gains and finding support at this new altitude. This week also saw the activation of the Bitcoin Taproot upgrade, a remarkable achievement for the network, contributors, and BTC holders.
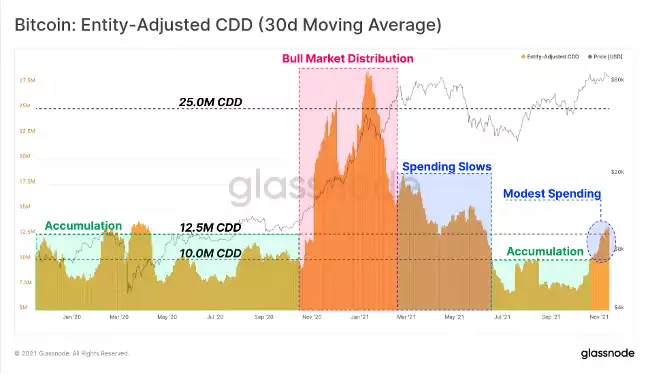
One of the most powerful on-chain tools to track this inflection point is the concept of lifespan, measured by coin-days destroyed (CDD). Each unit of BTC accumulates one coin-day per day (i.e. 0.5BTC accumulates half a coin-day per day). When the coin is spent, the accumulated lifespan is destroyed, is reset to zero, and begins re-accumulating again.
When old coins with large accumulated lifespans are spent, it will destroy a greater number of coin-days, and is often associated with long-term investors exiting positions. Bull markets can usually absorb many months of this distribution, but as the selling continues, the probability of establishing a top increase.
The chart below shows the 30d moving average of CDD, and demonstrates the current transition from heavy accumulation in July to November, and into an uptrend signifying increased spending. Note also how the magnitude of CDD in H1 2021 is notably higher and was sustained for months. This highlights how an excess of demand through the bull market was capable of absorbing the distributed supply.
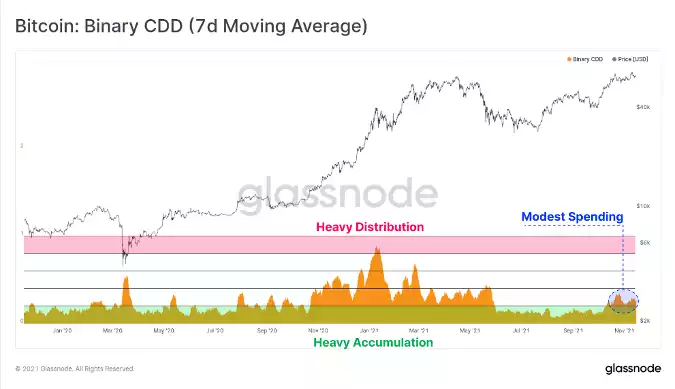
CDD with a 7-day moving average shows these trends in a more responsive format. This metric will trend higher when CDD is higher than the long-term average for extended periods. We can see that whilst it is currently elevated, Binary CDD is barely above a value of 0.2, which has parallels to Sept-Nov 2020 before the primary bullish impulse. Spending of older coins is happening, but it remains small in relative magnitude.
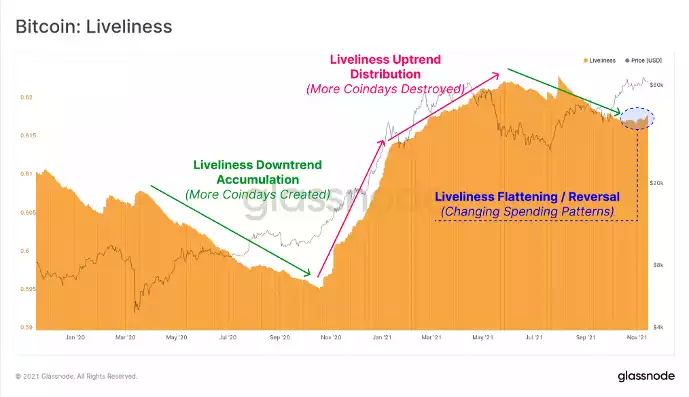
On a macro scale, we look to Liveliness which takes the ratio between cumulative coin-day destruction, and cumulative coin-day creation. The simple interpretation is:
- Liveliness trends lower when more coin dormancy and HODLing is in play.
- Liveliness trends higher when more coin-day destruction and spending is in play.
- Steeper curves mean greater HODLing/Distribution as appropriate.
Here we can see that after 6-months of HODLing (downtrend, green), Liveliness has plateaued and started a very slight uptrend. Similar to CDD and Binary CDD, this uptrend is only just being established, and far shallower than was seen in H1 2021. It again speaks to this inflection point in spending behaviour by older hands.
Spending behaviour by more experienced investors has increased of late. The next step is to estimate the magnitude of sell-side pressure, and thus the capital inflows needed to absorb it. Whilst a large amount of trading occurs off-chain on spot and derivatives exchanges, we can layer in on-chain datasets to establish a lower bound of capital inflows and outflows to the network.
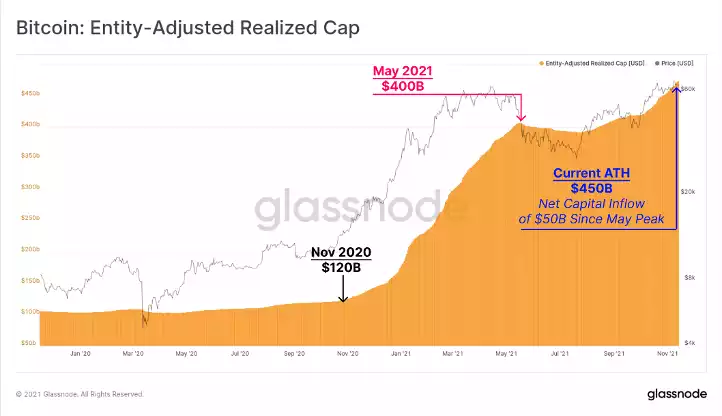
One of the most intuitive examples of this is the Realised Cap (entity-adjusted in this case to filter out internal transfers). This metric value every coin in the supply at the price it last moved on-chain, reflecting the accumulation of net realised profits minus losses. Each time a coin is moved at a profit it will add value to the realised cap. Conversely, realised losses will subtract from it, reflecting capital outflows.
The Realised Cap has resumed an uptrend and reached an ATH of $450B, as coins are distributed and revalued higher. This represents a net capital inflow of $50B since the previous peak in May, set during the sell-off.
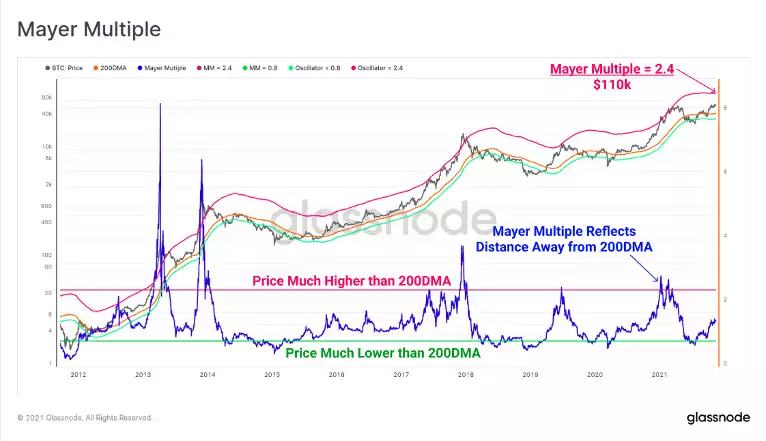
Identifying Bitcoin market tops is no easy feat. However, with over a decade of on-chain and market data at our disposal, we can use tools to identify behaviours and cyclical patterns that signalled market tops in the past.
The Mayer Multiple, calculated as a simple yet effective ratio between price, and the 200DMA. Using statistical methods, we can establish that a Mayer Multiple value of 2.4 reflects an unlikely extreme, where price has rallied to 2.4x the long-term and well-observed 200DMA. This provides an upper pricing band, currently sitting at $110k, although it will trend higher (or lower) as the 200DMA price changes.
Each way you poke BTC at the moment, it looks like the market is setting up for something big. If the onchain dynamics are to continue as they have, then BTC has set itself up a great base to find further gains.