Bitcoin on Verge of Breakout?
News
|
Posted 13/07/2021
|
8366
It has been an impressively quiet week in the crypto markets. Compressed prices alongside low volume indicate that we should see some significant action any day now. The direction this breakout moves will determine what the next few months will look like for BTC. The “quiet before the storm” is supported by various on-chain metrics in Glassnode’s Weekly Report. Let’s have a look at some of their analysis…
One of the most significant factors in the Bitcoin market at the moment is the great miner migration as the China ban came into effect. Glassnode’s report suggests that the quicker that the Bitcoin hash-rate recovers, the less selling pressure there will be on the market, stating the following;
- Rapid hash-rate recovery may suggest offline miners have successfully relocated or re-established their hardware, recovering costs and likely reducing the risk of treasury liquidation sell-pressure.
- Slow hash-rate recovery may suggest the converse, where costs and outages continue to take a financial toll, and thus increases the risk of treasury sales.
This week, the hash rate has recovered from the peak-trough decline of 55% to around a 39% decline. Should this level hold and be representative, it would indicate that hash-power equivalent to around ~29% of the affected hash-power has come back online.

As we run out of short-term holders selling pressure, the more the miners market becomes the only downward pressure on the market, hence the importance of how the miner migration plays out. Miners who have remained in operation during this migration period have seen significant profitability increases and have begun stacking their BTC. What this indicates is that the only selling pressure in the market is;
- Short-term holders capitulating
- Offline miners
Glassnode touches on short-term holder capitulation, supporting the thesis that they are running out of steam by stating the following;
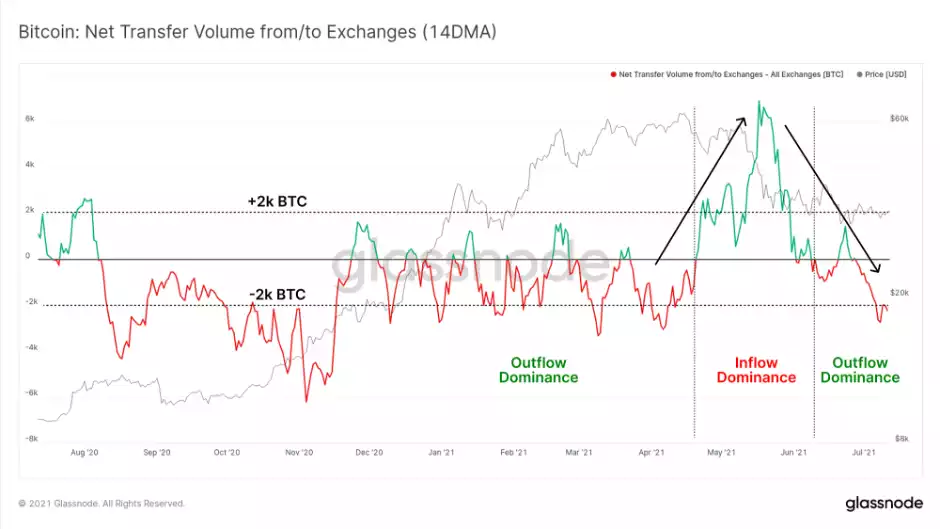
A key theme throughout 2020 and Q1 2021 was relentless depletion of exchange coin reserves, with many of them en route to the Grayscale GBTC Trust, or accumulated by institutions. This showed up as a persistent net outflow from exchanges.
Throughout May, this trend dramatically reversed as a flood of BTC was deposited to exchanges, alongside the market selling off by ~50%. On a 14-day moving average basis, the last two weeks in particular have seen a more positive return to exchange outflows, at a rate of ~2k BTC per day.
The ASOL metric captures the average age of spent outputs daily. Being that ASOL considers only the average age of spent outputs (not coin volumes), it is largely unaffected by quiet mempools. Similar to the 2017 and 2019 peaks, the average age of spent outputs is rapidly collapsing, indicative of a return to higher conviction HODLing and likely accumulation.
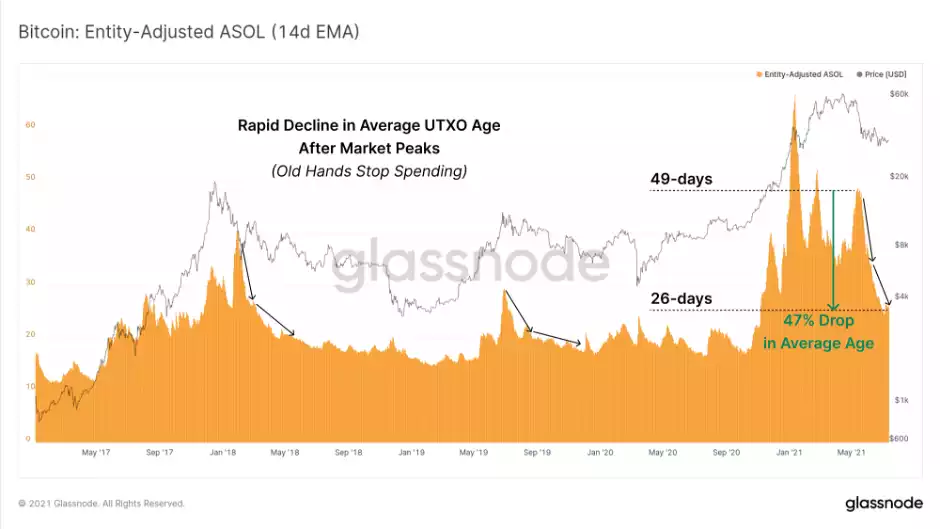
ASOL suggests that overall, older coins are increasingly inactive. The HODL waves provide more data points to support this thesis.
The age of coins reflect two groups of strong conviction buyers, both of which held through significant volatility:
- 2y-3y Holders accumulated in the bear market from late 2018 through to the 2019 peak. These investors currently hold 9.8% of the supply.
- Since March 2020, 5.2% of the circulating supply has 'matured' from the 2y-3y band into the 3y-5y band.
- 3y-5y Holders accumulated between July 2016 and July 2018, and thus represent last cycles bull market buyers. This cohort continues to grow, now representing 13.1% of the supply. These investors bought between $640 and the previous ATH at $20k and have held through significant volatility.
For middle-aged coins (6m to 2y old), data supports that through Q1 of this year, these investors were largely distributing (declining waves). The accumulation range for those Q1 sellers extends as far back as January 2019 after the 2018 capitulation to $3,000.
Coins aged 6m-12m are this cycle’s bull market buyers and now hold 9% of the coin supply. This age band has started to notably swell starting in early April, indicating that a large proportion of buyers from Nov-Dec 2020 have not spent their coins.
The evolution of these 'middle aged' HODL waves over the next three months will be key to appreciating how much of the 'early institutional supply' remains tightly held, or conversely, was sold over recently.
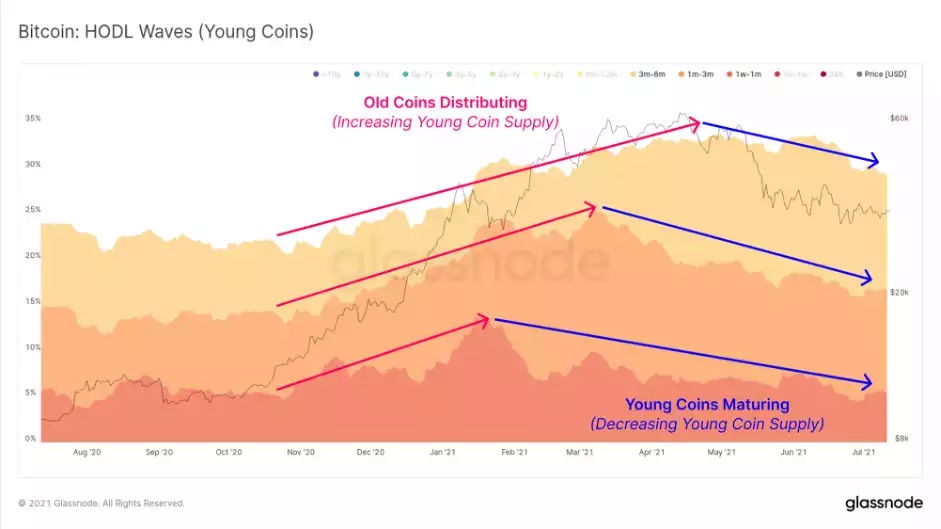
Finally, Glassnode investigate the youngest economically meaningful coins, those aged between 1m and 6m. These represent bull market buyers who were generally buying coins off longer-term holders who were realising profits. This behaviour is evident from Nov 2020 to May 2021 as the young coin supply swelled from ~22% to over 32%.
However, since the sell-off in May, the young coin supply has commenced a structural downtrend which indicates coins are maturing, HODLing is taking place, and accumulation is likely underway.
It is favourable for the price if young coin supply continues to decline (old coins dormant and young coins maturing). Conversely, large spikes in young coin supply suggest renewed distribution and would favour a bearish bias.
The best-case scenario in this market is that we have already seen the bottom and are forming a long and complex bottoming pattern. A lot of Glassnode’s analysis support this thesis. If we have seen the last of the large capitulation event, we should begin to see the price slowly pick up from here as more buyers enter the market and sentiment swings away from extreme fear. A bull market continuation certainly is on the cards, don’t miss the bottom!