Bitcoin Breaks Consolidation Range
News
|
Posted 29/03/2022
|
6994
The Bitcoin market has seen a stronger week, rallying off the lows of $40,710 US, and breaking out of the consolidation range to a new local high of $47,649. This is the first sustained rally after many months of sideways choppy price action.
The process of bottom formation and investor capitulation in a bear market is often lengthy and painful, and Bitcoin is still working its way out of the bottom. Let’s dive in…
One of the foundational tools we use to assess investor conviction in the on-chain analysis is coin lifespan (or coin age). Lifespan is broadly defined as the time since the coin was last moved (time since UTXO creation).
Statistically speaking, the longer a coin remains dormant, the more likely it is to remain so. Given Bitcoin's characteristic volatility, investors who hold coins for an extended time are more likely to experience wild price swings and are thus more likely to be experienced, and have higher conviction.
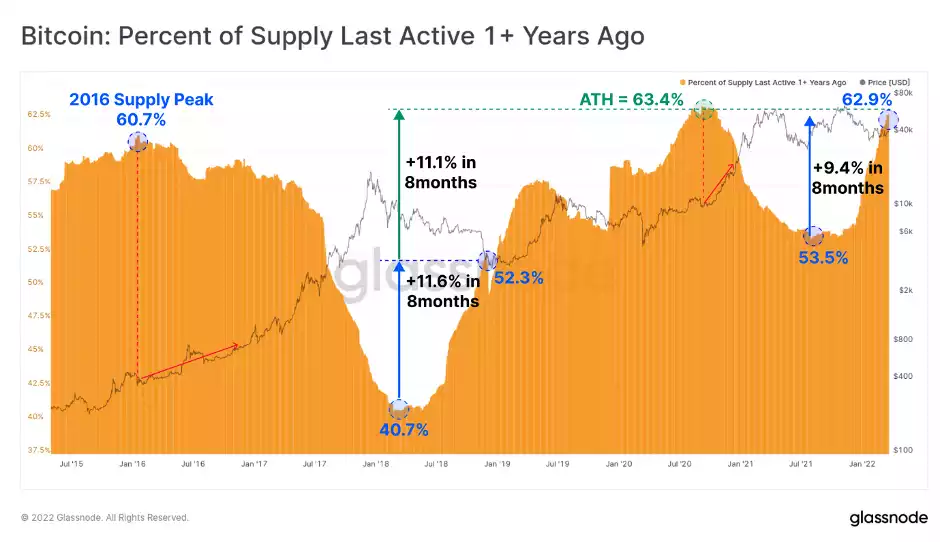
As we approach the end of Q1-2022, we can see an extraordinary increase in the proportion of coins aged 1yr+, which has risen by 9.4% of circulating supply over the last 8-months. These coins largely reflect BTC volumes accumulated in the Q1-2021 phase of the bull market and the owners have thus held through two 50%+ drawdowns and three all-time highs. This recovery is quite similar in scale and duration to the 2018-19 recovery.
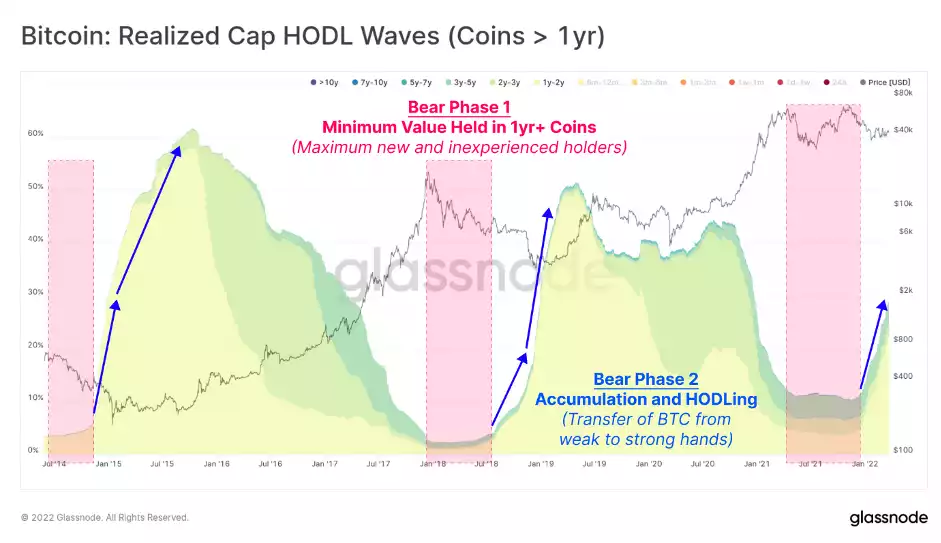
Whilst the chart above shows BTC volume > 1yr as a proportion of circulating supply, it is also useful to know how much USD denominated 'wealth' is held in those coins. The reality is that most investors make decisions regarding portfolio allocations concerning its fiat denominated value, and cost basis, and thus proportional USD value is very relevant.
The Realized Cap HODL waves are the ideal tool for this assessment, and the chart below is filtered for these same 1yr+ old coins. We can see the following:
- Q2-Q4 of 2021 has many similarities to past bear markets where the total wealth held in 1yr+ coins reached a cycle minimum from May to Dec 2021.
- Bear Phase 1: When a low proportion of wealth is held by older, more experienced investors, it means the converse is true, and much of the wealth is held by newer, less experienced investors, which is top formation and bear market material.
- Bear Phase 2: This wealth disparity is recovering strongly as more coins transition into 1yr+ age bands, and more wealth, with a higher cost basis, is HODLed (setting a higher floor value than the last cycle).
The current market is in the process of recovering (Phase 2), however, it can be seen in past cycles, this process can take many months for a price floor to fully form, and find sustained upside momentum.
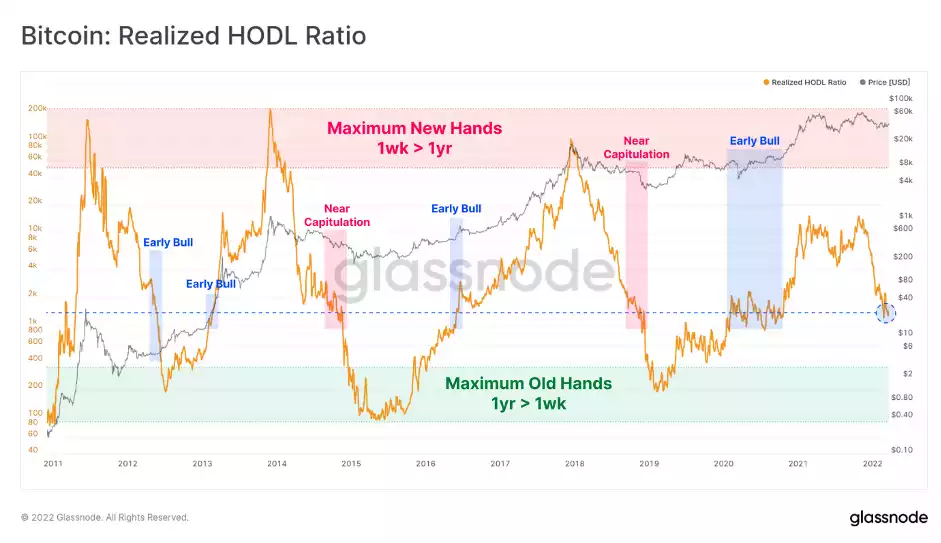
The RHODL Ratio captures behaviour into a single elegant oscillator. It's calculated as the ratio between 1-week old, and 1yr-old Realized Cap HODL Wave bands. It will peak when a maximum USD wealth is held by new investors (market tops) and bottom when more of the wealth is held by 1yr age bands (market bottoms).
Here we can see a macro downtrend is in now play, reflecting the growth in 1yr+ coins moving into the metric denominator. RHODL currently describes a balance between new, and experienced HODLers that is coincident with late-stage bear markets, and also with early-stage bull markets. Note however that only in 2012 was RHODL in a macro downtrend, whilst market pricing was in a bull market.
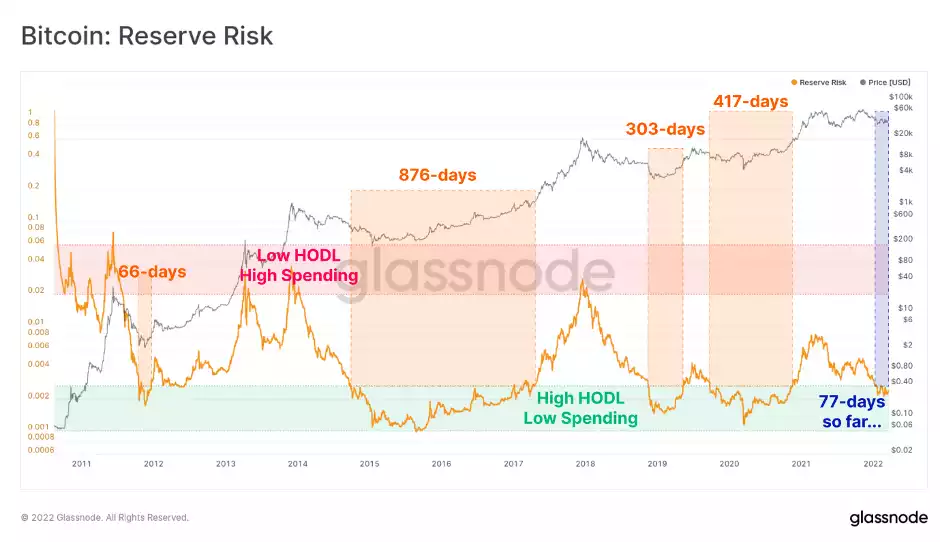
Another oscillator that captures an impressive amount of investor psychology one elegant curve is Reserve Risk. This metric will trade at low levels when there is heavy investor accumulation and HODLing is the preferred market strategy. Conversely, it is extremely reflexive to the upside (requires a log scale) when these experienced investors exit their positions.
Reserve Risk has traded at historically undervalued levels for 77-days so far, although this is far shorter than the multi-year periods seen in 2015-17 and 2018-20. Note however that Reserve Risk generally signals undervaluation well into the bull market as HODLers typically commence distribution only after a new price ATH is set.
To conclude, Bitcoin bear markets can be long, painful, and drawn out, however, they have the ultimate result of reshuffling supply ownership away from weaker, and towards stronger hands. Bitcoin has seen fairly heavy accumulation occur between $35k and $42k, suggesting many investors see a value zone in the current consolidation range.
There is modest spending that has taken place over the past few weeks, with much of it being coins held at a loss. As a result, the aggregate cost bases of both Long- and Short-Term holders are in decline, the former to a historically significant degree. So far, the Bitcoin bulls have provided adequate support. Let’s see if it continues further into the week.