Australia’s 2020 Economic Journey in Charts
News
|
Posted 25/09/2020
|
11042
Today we present and discuss a series of charts from Roy Morgan Research presenting the economic impacts on Australia since the pandemic. But first, last night saw a volatile market on Wall St with shares eventually ending slightly up, the US dollar essentially flat, and strong rallies in both gold and silver leaving people wondering if the dip is finished or if this is a momentary reprieve. CitiBank note these gyrations in price will continue but maintain their $2400 target. From their report: “
- maintain our 0-3m point-price target at $2,200/oz and a 6-12m target at $2,400/oz.
- We lift the 2021E base case gold price forecast by ~$300/oz, versus our early July update, to a record $2,275/oz.
- Occasional liquidation squeezes, drawdowns, and profit-taking activity for gold seem likely in a high volatility market environment. But investors will probably buy that dip on the back of an accommodative central bank reaction function.
- Record weak gold jewelry consumption and tepid official sector gold demand may limit the performance of gold
- The record pace of inflows and overall growth in bullion ETF holdings reflects strong investor appetite for gold.
- Greater inclusion of gold by portfolio asset allocators, especially nontraditional players (e.g., pensions, insurance, family offices), is a further tailwind for the bullish gold thesis in the medium-term.
- Current Fed policy and liquidity provisions have also tempered concerns about another sharp collapse in inflation expectations. So the overall gold price trend should, on balance, remain upward sloping in the current regime.”
The AUD took a belting this week as the USD surged which of course softened the blow of the metals correction in our local currency. There is plenty of downward pressure on the AUD and the Aussie economy in general. Roy Morgan Research just released a series of self explanatory charts mapping our journey so far in what has been a year for the record books.
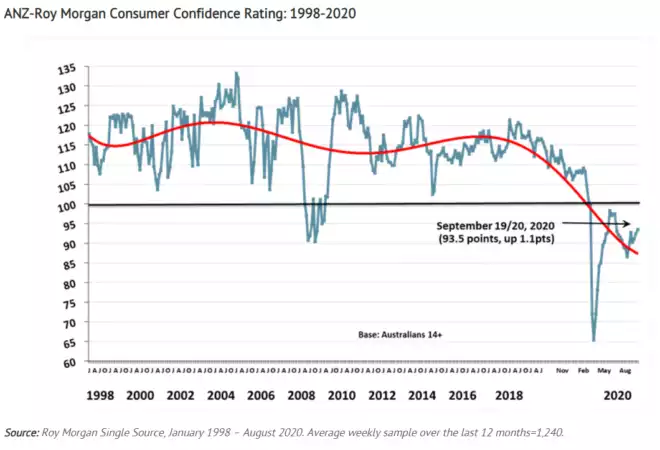
Firstly, you can see we are still at consumer confidence levels near the worst of the GFC after visiting territory nearly 3 times worse again in March and April. You will note too the gyrations during the GFC as hope is dashed by reality repeatedly before a recovery.
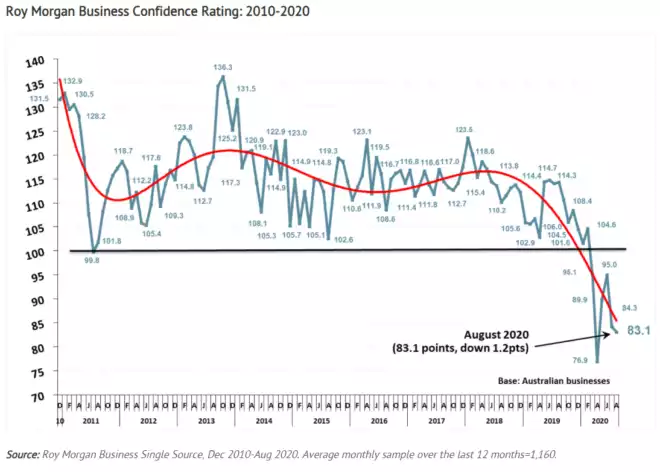
Those at the coal face, the owners of businesses where rubber hits the road, are far less optimistic and the trajectory is sharply down:
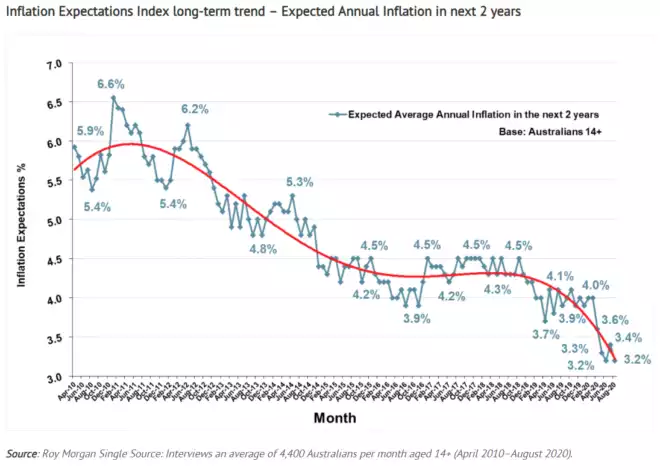
Current inflation expectations over the next 2 years are interesting. You will note how high they have been and still are compared to official measure. This potentially speaks to a number of things but likely reflects what many say and that is the CPI is not an accurate measure of real inflation. The ‘basket of goods’ and normalisations applied does not reflect what real Australians are experiencing. Another factor at play in such a survey may be the ‘perception’ of inflation. By that we mean the reality of the combination of stagnant, and more recently falling wages combined with rising costs is ‘feeling’ more like 3.2% when the official core rate is 1.7%. Regardless the trend is heading to deflation which should see our sleepy/conservative finally RBA move to ‘unconventionally’ stimulate and likewise our Government, putting further downward pressure on the AUD and debasing your hard earned further.
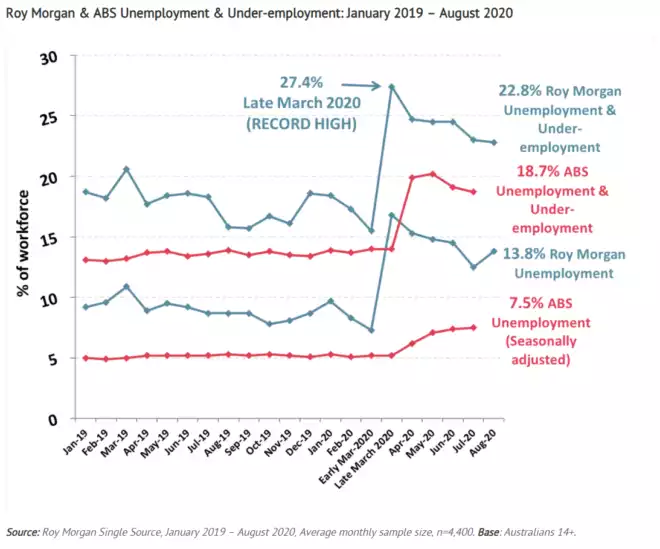
We shared the following employment figures last week on the release of Australia’s ‘headline great’ but ‘reality awful’ employment numbers:
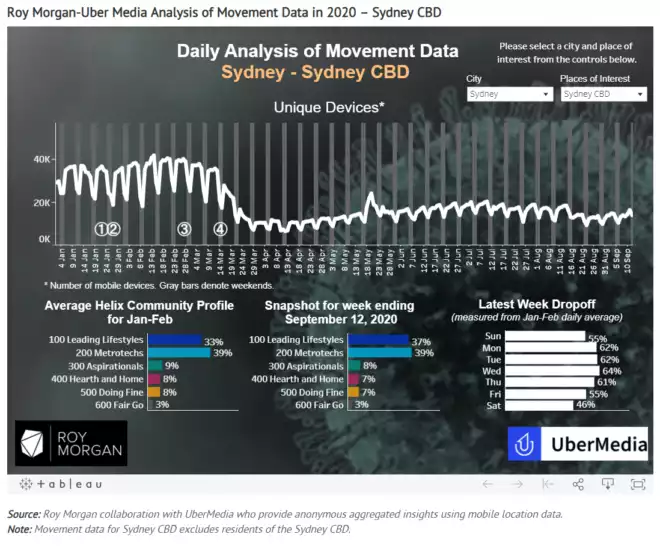
Finally they present the movement data for our 2 biggest cities. Whilst arguably a little anecdotal, the reality cannot be dismissed. Even ‘model’ city Sydney is still literally half the visitations to the CBD than before the pandemic. Melbourne, as you’d expect, is nothing short of disastrous. This analysis is not unique to Roy Morgan. Real Vision’s Raoul Pal often talks to the (GPS device) TomTom data illustrating clearly the real impact on human behaviour in the pandemic. These missing trips are people not going to work, they are leaving commercial towers proportionately empty, they are not buying their coffee, their lunch or going to the bar afterwards. This data is actually incredibly instructive on the real impacts of this virus and why the above business confidence chart remains so bad. Consumer confidence is more fickle. Humans can get a ‘new normal’ baseline as they adjust. Businesses look at ‘unadjustable’ realities like P&L’s and Balance Sheets.