Aussie Property & Rising Rates - “largest property correction on record”
News
|
Posted 05/11/2021
|
12488
Gold and silver had strong rallies last night, reclaiming what was lost after the Fed taper announcement and more. Whilst the financial markets rejoice at the Fed maintaining zero interest rates for longer and only very slowly reducing QE, the realization that this will do nothing to quell surging inflation is returning to the investment narrative.

Of course inflation can be great for Aussie housing but when that is largely driven by near zero interest rates and huge loans amid tepid wage growth the question inevitably becomes one of ‘what happens when rates rise’? The RBA and Fed etc don’t have complete control of rates and so whilst they may say rates won’t rise until 2023 or 2024, they may not maintain that control.
As we have written before (here and here), the RBA has been using Yield Curve Control, buying as many 3 years Aussie bonds as needed to maintain the yield initially at 0.25% and then 0.1% to guarantee cheap debt for years to come. As we reported at the last RBA meeting they announced they would end that program target at April 2024. However last Thursday the 3 year bond yield starting climbing above the 0.1% target and the RBA went AWOL seeing it rise to 0.7% and onward to 1.0% by Monday, more than 10 times their target. The writing was clearly on the wall for their Tuesday announcement that they would no longer use ‘our’ money to defend the line. RBA boss Philip Lowe explained it would have been “untenable” to try and would eventually see the RBA own all 3 year bonds to do so (ala Bank of Japan).
Writing for the AFR, Coolabah’s Chris Joye is warning the inevitable rise in rates could see the “largest property correction on record”.
“Yet if and when the RBA does seek to normalise the cash rate, prices should fall, as night follows day. And if the RBA is able to lift rates by 100 basis points or more, it will likely be the largest correction on record.
Assuming rates increase relatively promptly over, say, a 12 month period, we would expect national home values to decline by 15% to 25%. It is possible that the adjustment is smaller if the RBA moves more slowly and the value of residential real estate mean-reverts partly via household income growth over the effluxion of time. But our central case would be a circa 20 per cent decline after the first 100 basis points of hikes [just 1%].
It’s worth noting that if we apply the RBA’s internal housing valuation model to this question, we get somewhat larger numbers. The model developed by Peter Tulip and Trent Saunders, which we have replicated and refined, suggests dwelling values could drop by about 33% following 100 basis points of hikes. While renters might embrace this prospect, home owners would obviously rather avoid it.”
The current investment landscape has arguably never been more difficult to read. Not a lot makes sense but never have we had the confluence of a pandemic, staggeringly unprecedented monetary stimulus, geopolitical and global trade tensions, technological and demographic disruption and of course a debt pile the size of this one. These are all inextricably linked and often competing influences. Such times test the mantra of the 4 most expensive words in investment – “its different this time”.
What seems irrefutable though is there are many ‘assets’ out there over inflated on stimulus and easy money that simply can’t go on. Hard assets such as precious metals, good quality property, and if you ‘get it’, Bitcoin (stored securely). Chris Joye highlights the inherent danger of a relatively illiquid asset incredibly inflated by cheap money (the full article is repeated below).
Precious metals are highly liquid assets that took off strongly last year but then have partly corrected and now chopping sideways as the market weighs up the ‘recovery’ and ‘transitory’ inflation narrative peddled by the Fed. This year they have not had the run property has already. Many analysts believe that is about to change and change in a demonstrable way. If ‘buy low, sell high’ is your thing, its time to start looking.
Below is the Chris Joye article in full (be sure to read his track record at the end… hard to ignore):
“Over a decade ago we argued that the community should come to expect much more volatility from residential property because of the huge increase in the household debt-to-income ratio, which had made borrowers far more sensitive to interest rate changes. At the time, we asserted that this would generate a more frequent boom-bust cycle in prices as a result of variations in borrowing rates.
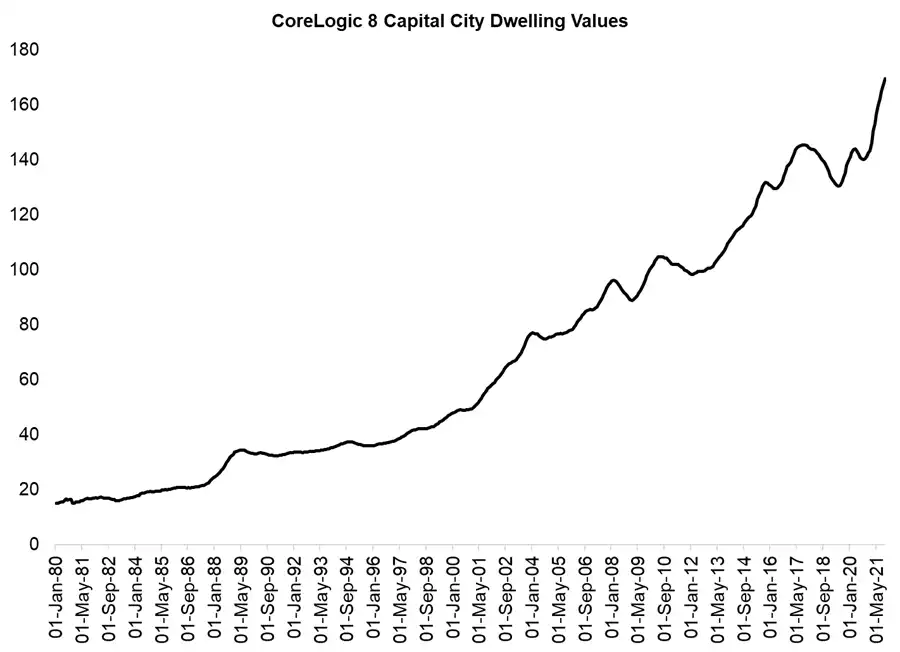
If you look at the enclosed chart of CoreLogic’s 8 capital city hedonic index, you can see that substantial drawdowns in prices were relatively rare between 1980 and 2003. And yet since 2003, there have been six distinct episodes in which prices have declined with what appears to be increasing severity. It might come as a surprise that the single biggest fall in Aussie house prices over the last 40 years was the innocuous episode between September 2017 and June 2019 when capital city values dropped by a record 10.2% care of the imposition of APRA’s macro-prudential constraints on lending. The losses at this juncture were, in fact, much worse than those experienced during either the GFC or the COVID-19 induced recession.
Since the end of the 2017 correction, capital city home values have climbed by a robust 30%. The capital gains following the much more mild COVID-19 retrenchment have been 21%. Going back to the end of the 2010 to 2011 downturn, we find that home owners have profited from a 72% increase in the value of their most important asset. That means that dwelling values have appreciated at a circa 6% annualised pace over the last decade. And that is at the overall asset (or property) level, assuming no gearing. Accounting for the use of significant amounts of leverage, the actual tax-free return on equity home owners have captured has been much higher again.
What will happen when the RBA hikes?
The RBA has made it abundantly clear that it is going to be highly resistant to lifting its cash rate until it observes consistent annual wage growth of 3% to 4% coupled with core inflation sustainably sitting at or above the mid-point of its target 2% to 3% band. This implies that it will not touch rates until sometime between late 2022 and mid 2023.
As I explain in more detail below, we are still forecasting ongoing house price appreciation until the RBA hikes and/or banks materially lift mortgage rates. More specifically, home values should climb by another 5 to 10 percentage points from present levels. So there is some upside left in this trade.
Yet if and when the RBA does seek to normalise the cash rate, prices should fall, as night follows day. And if the RBA is able to lift rates by 100 basis points or more, it will likely be the largest correction on record.
Assuming rates increase relatively promptly over, say, a 12 month period, we would expect national home values to decline by 15% to 25%. It is possible that the adjustment is smaller if the RBA moves more slowly and the value of residential real estate mean-reverts partly via household income growth over the effluxion of time. But our central case would be a circa 20 per cent decline after the first 100 basis points of hikes.
It’s worth noting that if we apply the RBA’s internal housing valuation model to this question, we get somewhat larger numbers. The model developed by Peter Tulip and Trent Saunders, which we have replicated and refined, suggests dwelling values could drop by about 33% following 100 basis points of hikes. While renters might embrace this prospect, home owners would obviously rather avoid it.
Bull vs bear backstory…
I want to conclude with some comments on the relentless ‘bull’ versus ‘bear’ stereotyping. We are neither: we are just trying to divine the direction of the market.
By way of background, we were the first to call a 10% correction in Aussie house prices in 2017, which is what transpired between September 2017 and June 2019. We were also the first to anticipate a 10% rise in prices in April 2019, which is what materialised prior to the COVID-19 shock.
To the best of our knowledge, we were the only forecasters to predict both a modest 0% to 5% drop in home values between March and September 2020 (they fell 2.7% across the capital cities) and a subsequent 10% to 20% increase in prices starting in September of that year (see here).
Since September 2020, capital city dwelling values have appreciated 21%. Our 10% to 20% forecast for future capital gains following a modest dip between March and September 2020 was predicated on the assumption of 100 basis points of rate cuts. Accounting for the steeper fixed-rate mortgage reductions that ensued care of the RBA lending $188 billion of ultra-cheap, 3-year money to banks, we adjusted our expectation for the price rise to 20% to 30%, which we are on track to achieve.
Going back further in time, we forecast that prices would soften in late 2010 following a series of aggressive RBA rate hikes, which they did (capital city prices declined by 6% between late 2010 through to the end of 2011). Yet in 2010, doomsayer Jeremy Grantham had other ideas, claiming that Aussie house prices would plunge 42%. We bet Grantham $100 million against the CoreLogic index that prices would be higher, not lower, in 3 years’ time even though we were a little bearish on the immediate term outlook. Over the period covered by this proposed wager, dwelling values did indeed climb by 5.8%.
In early 2012, we got into a debate about whether the housing market was starting to recover: our data suggested it was, whereas others felt prices were still falling. We now know prices began appreciating in January of that year.
In 2013 we argued that the RBA’s rate cuts would trigger a housing boom and years of double-digit price growth, which would eventually morph into a bubble. The RBA panned the proposition at the time. Yet that’s precisely what we got between 2013 and 2017, which eventually compelled APRA to aggressively intervene.
Finally, way back in 2008 we argued that the national housing correction wrought by the GFC would be modest, regularly debating the likes of Steve Keen and others who predicted much more calamitous 30% to 40% price falls. In practice, dwelling values retrenched by just 6.4% in 2008 and promptly rebounded by 12.2% in 2009.”