Another ETF Gold Inflow Record
News
|
Posted 08/06/2020
|
22877
Inflows of gold into ETF’s broke another record in May as investors continue to flood into gold. The World Gold Council just released their ETF Monthly figures for May and it saw inflows through May outpace records for any calendar year in only 5 months.
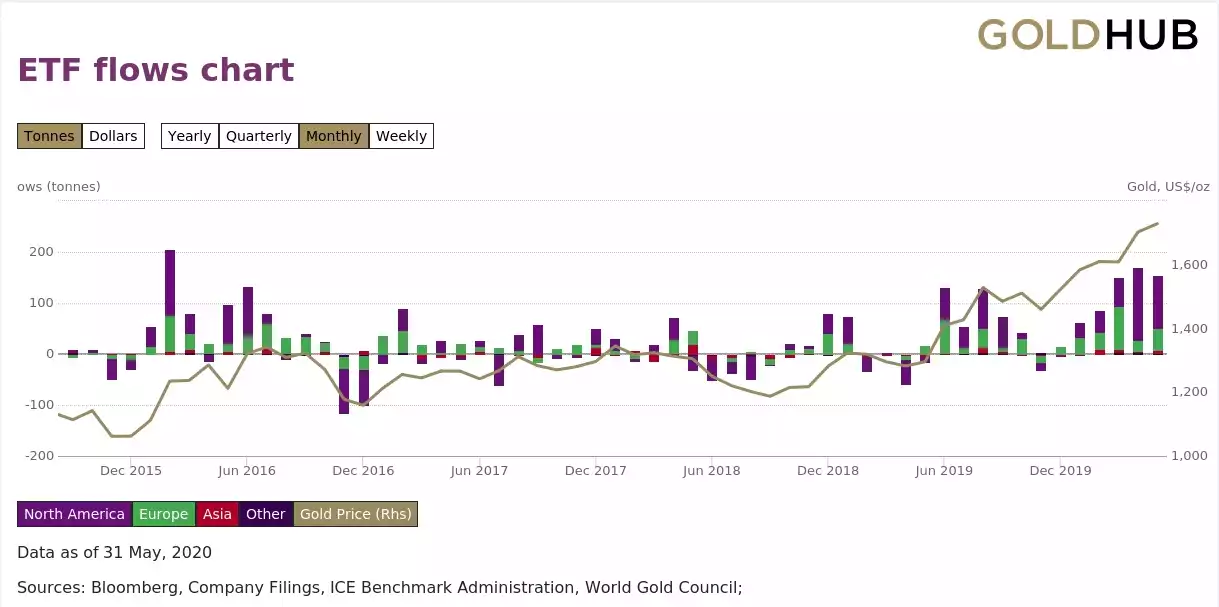
In May alone gold ETF’s expanded 4.3% or 154 tonne of gold worth over US$8.5b. Year to date we’ve seen US$33.7b added to holdings, eclipsing the previous year to date record of US424b in 2016. That takes total global holdings to a new all time high of 3,510 tonne.
As you can note from the chart below, that previous 2016 record was also very different in that it came off that record breaking month of February of 205 tonne. This time we have 3 consecutive months above 150 tonne, something never done before, and the consistency of inflows was notable too. From WGC:
“Global gold ETFs had inflows in all but two trading days during April and May (41 of 43 days). The only other historical period with similarly consistent inflows occurred in May and June of 2016, when funds experienced inflows in all but four trading days.”
The chart below shows gold inflows and outflows since the beginning of this gold bull market in November 2015.
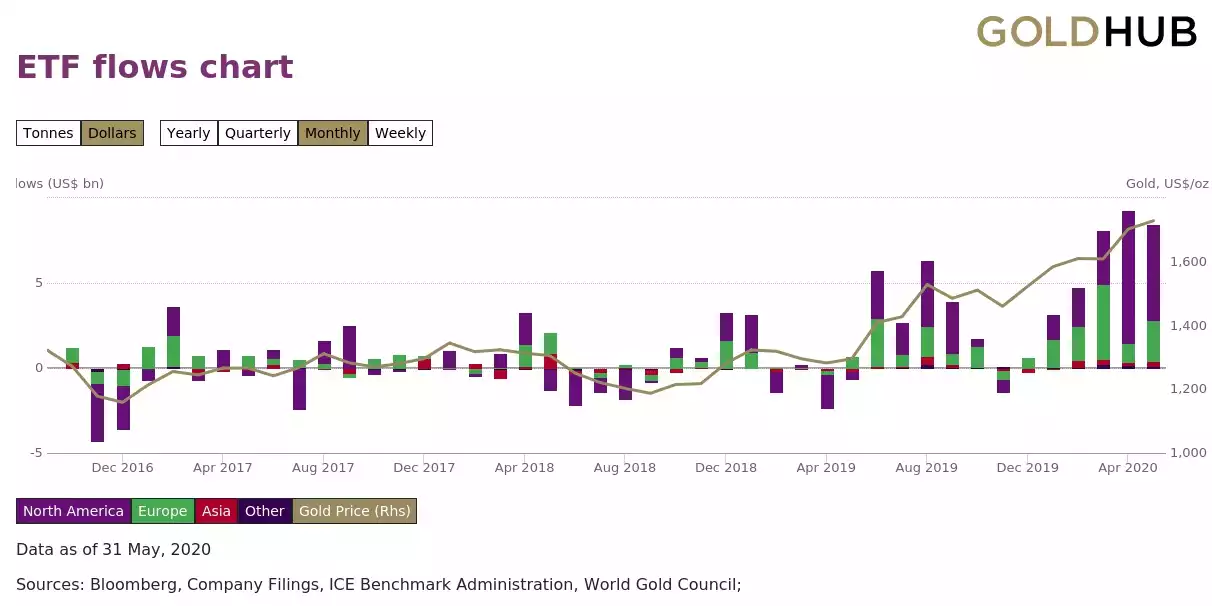
When viewed in value not weight, the correlation between ETF flows and the price becomes more apparent:
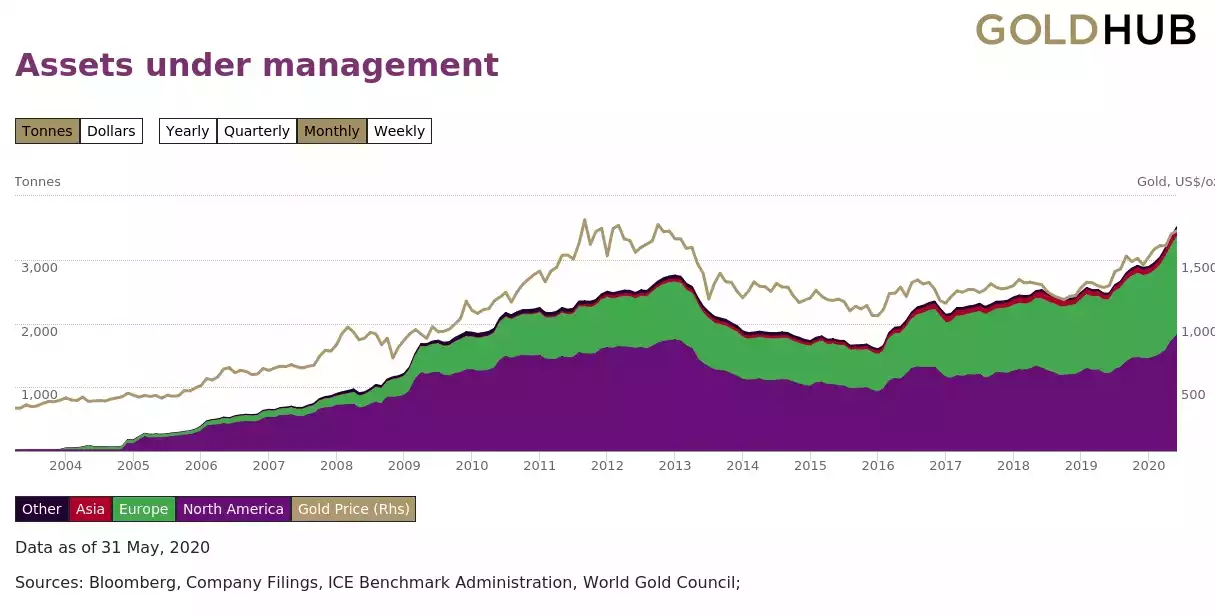
As you can see below too, the expansion of European holdings is huge, with their 1537 tonne approaching North America’s 1815 tonne. Arguably the Eurozone is in a deeper mess than the US and also the home to negative interest rates and so maybe this should not be a surprise.
Famed London precious metals commentator Lawrie Williams, writing for Sharps Pixley, has this to say over the weekend:
“Despite the pressure under which gold and silver prices currently find themselves we think the momentum generated by the enormous flood of money going into the precious metals ETFs is indicative of things to come for the sector. We suspect that the $1,750 current ceiling for gold will be breached comprehensively by the northern hemisphere fall and $2,000 gold will not be too far behind, although there will be periods of resistance along the way. Anecdotal reports suggest that demand in China and India, the two leading gold consumers, is beginning to to turn up again, while global new mined gold production seems at last to be beginning to fall, both because of coronavirus related production losses and through other factors as we are already seeing in Australia, the world’s No.2 gold mining nation and as we have been seeing in China, the world No.1, for several years already. With the accelerating gold-related ETF rises worldwide, and as the world comes out of the coronavirus lockdowns, gold’s supply/demand fundamentals may be improving. While what we expect to be a severe equities plunge, coupled with perhaps a declining dollar index, should further enhance gold’s appeal as the ultimate safe haven investment – which should drag silver up with it. In our view the prospects look positive for both principal precious metals.”
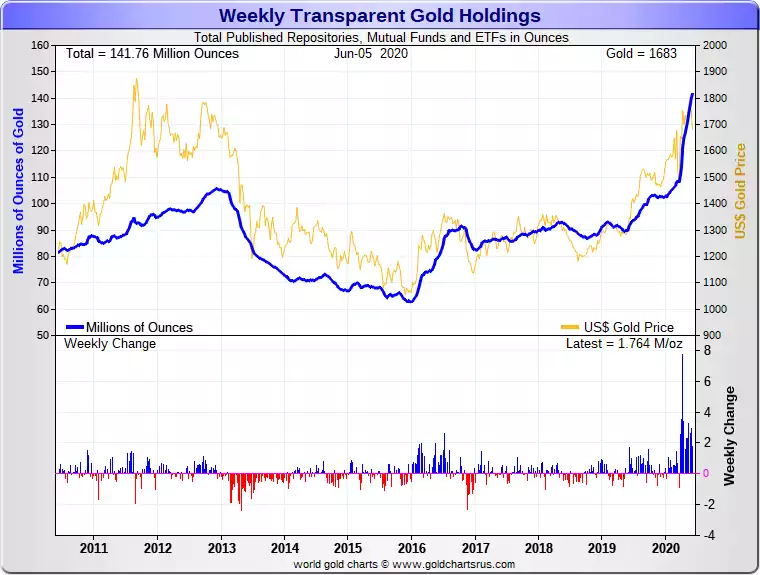
More broadly, looking at all transparent holdings of gold and silver, the following charts paint a clear picture of very strong demand for both metals.
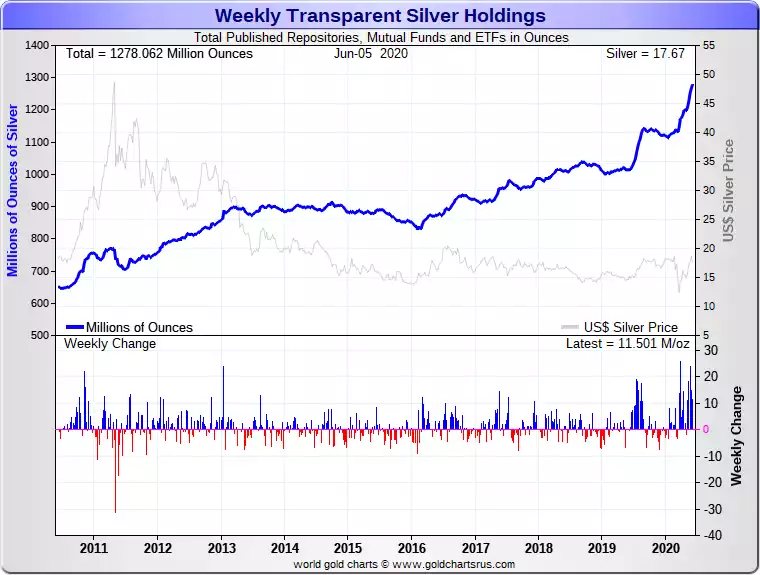
Interestingly too, off the back of the huge jump in shares on Wall St Friday night on the better than predicted NFP jobs report, this weekend saw a massive jump in online webshop orders here at Ainslie. This may well be people thinking we are at peak BS in the markets and just like all that gold and silver piling into ETF’s at the same time shares continue their illogical rally, they are getting their hedge against that unfolding in place. The difference of course is Ainslie customers are buying the real thing, the real hard asset without counterparty risk, not the paper promises of ETF and futures contracts….