50th Anniversary of Fiat and the end of the gold standard
News
|
Posted 13/08/2021
|
13283
Sunday marks the 50th Anniversary of the world’s reserve currency leaving the gold standard and going ‘full Fiat’. History shows a 100% track record of Fiat currency failure, normally within 40-60 years. That we are currently amidst a surging inflationary environment seems more than coincidental. Today, in the context of last night’s PPI print, we look to history for ‘where to from here’.
Inflation is back to the forefront of market’s minds. Earlier this week official inflation prints out of the US showed CPI remaining high but within expectations at 5.4% in July from a year earlier, 0.5% for the month, in line with June’s figure and matching the largest jump since August 2008. However Core CPI rose 0.3% for the month, just below expectations of 0.4% and up 4.3% for the year. That slight ‘miss’ helped the ‘transitory’ inflation narrative. Last night however that was smashed as the more ‘predictive’ PPI or Producer Price Index that tracks costs of material etc used to make things people will later buy, jumped to an all time record 7.8% or 1% in just one month. The following chart gives a little context:
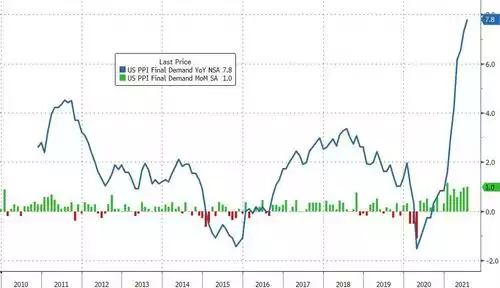
Basic math tells you that you can’t have such a margin between input costs and sales revenue for long before you have to pass that on to the consumer.
We wrote a couple of weeks back about the lessons from the 70’s inflation shock and why this time if different to that again. As mentioned in that article, this Sunday marks the 50th anniversary of the ending of the gold standard. Over the 50 years since, without the forced discipline of a gold backed reserve currency, we have seen currency debasement of an epic scale, but importantly, not general inflation in line with that. Instead we have seen just asset inflation seeing record high sharemarkets, property and bonds.
It is timely to reshare the famous quote from the even more famous economist Milton Friedman who said, “Inflation is always and everywhere a monetary phenomenon in the sense that it is and can be produced only by a more rapid increase in the quantity of money than in output.”
Another stalwart is Egon von Greyerz of GoldSwitzerland.com who wrote exactly of this and the anniversary on Sunday recently and shared the following table illustrating the extent of that currency debasement.
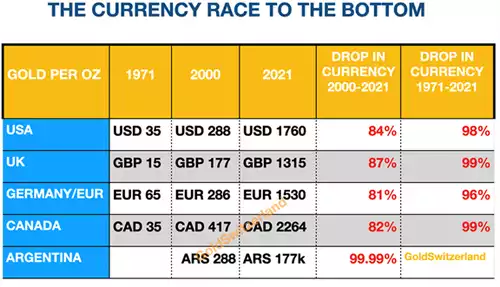
“From 1971 to 2011 the growth seems modest at a compound annual growth (CAGR) of 6%. If the dollar purchasing power declined by the same rate, it would lead to prices doubling every 12 years. Or put in other terms, the value of the currency on average would drop by 50% every 12 years.
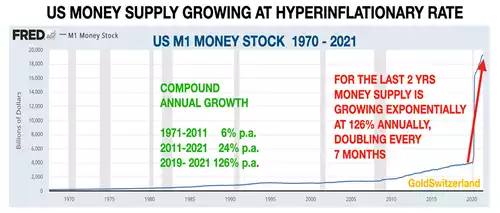
Then from 2011 when Money supply started growing in earnest, M1 has grown by 24% annually. This means that prices in theory should double every 3 years.
Finally, from August 2019 to August 2021 M1 has gone up by 126% a year. If that was translated to the purchasing power of the dollar it would lead to prices doubling every 7 months.
Von Mises defined inflation as growth in money supply and not in prices. The Western world until now has experienced very little consumer price inflation. Instead the credit expansion has created exponential inflation in asset prices.”
So where does this end?
“What we are seeing now is what von Mises called the Crack-up-Boom. Von Mises defined a crack-up-boom as:
- The crash of the credit and monetary system due to continual credit expansion leading to unsustainable and rapid price increases or inflation.
- The consequence would be “a final and total catastrophe of the currency system involved.”
The aforementioned article about the 70’s inflation concluded that this time was different, largely due to the debt burden now. That makes the 40’s the more instructive. From Crescat Capital’s latest investor report:
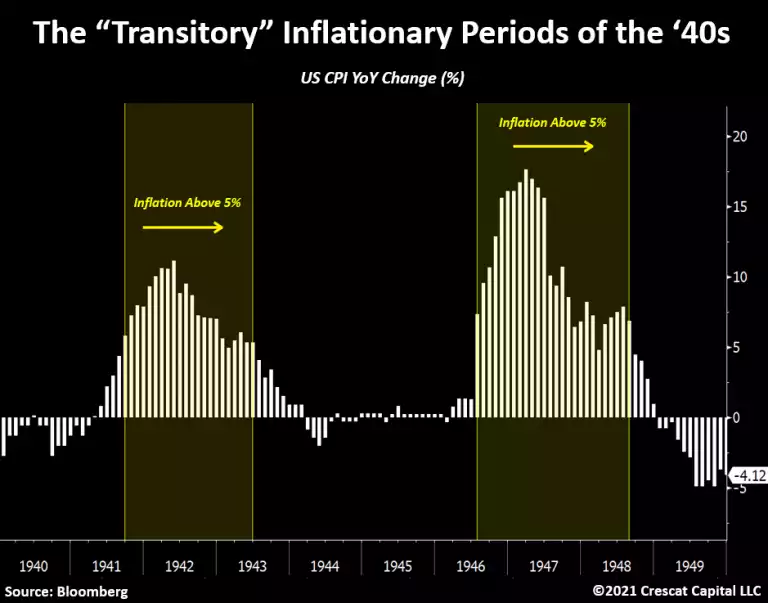
“In resemblance to today, the economy of the 1940s had high government debt and large fiscal deficits relative to GDP along with repressive Fed interest rate policies. It was a decade that included two sharp waves of increasing inflation in the Consumer Price Index, the first during World War II and the second right after it. Monthly CPI rose to a short-term peak of 13.2% on a year-over-year basis in 1942, and while it fell back down to 0% in 1944, it then spiked again to a higher peak of 19.7% in 1947, the highest year-over-year CPI increase of the last century. Note that during each of those inflationary spikes, CPI stayed above a 5% YoY rate every month for over two years. To our friends, “the deflationistas”, if this is an accurate roadmap to follow, buckle up, the rise in consumer prices is just getting started.”
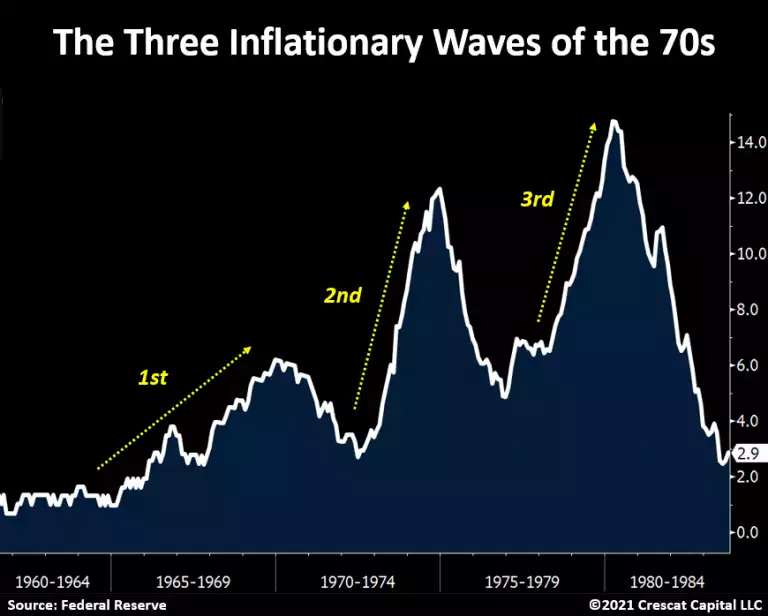
“Unlike the 1940s, when the US dollar was still pegged to gold, in the 1970s we had the abandonment of the gold standard which marked the onset of five decades of limited financial and monetary discipline ever escalating to the historic macro imbalances we have today. Such a shift in the monetary system was just as significant as today’s unlimited QE policies. The consequence of the macro setup during that era was that inflation rose in three waves from the late 1960s through the 1970s to reach a peak of 14.7% in 1980. Those waves were steadier and more persistent than the inflationary waves of the 1940s, we think due to the long-term, trending dynamic of the wage-price spiral that was at work.
Interestingly, both of those regimes, along with today’s, share one thing in common: negative real interest rates. The 1940s was the most financially repressive environment yet in that respect. The Fed at least allowed interest rates to rise in the 1970s, while inflation rose faster. From a market perspective, there was one important lesson from both periods: At times when investable assets yield less than inflation, owning tangible assets becomes imperative. Commodities were far-and-away the best performing asset class in both of those decades.
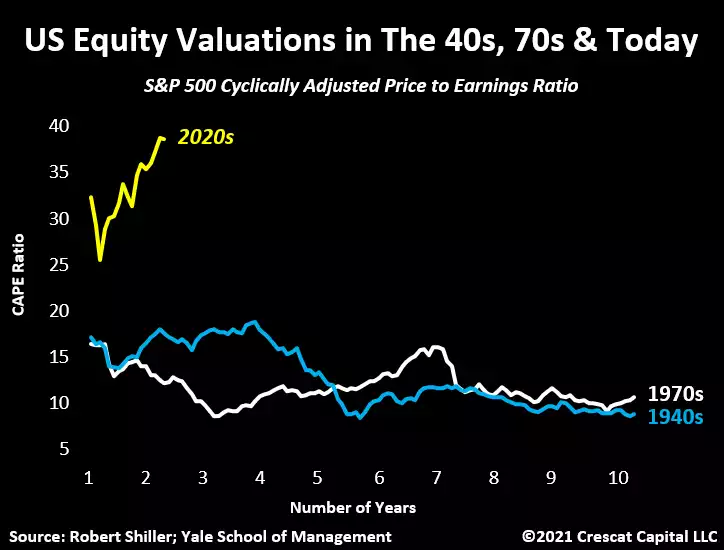
The Fed today is favoring the 1940s’ style of financial repression. It is “not even thinking about thinking about” raising interest rates anytime soon. The definition of financial repression is deliberate government and Fed policies that result in savers earning returns below the rate of inflation. The purpose of it is to inflate away excessive debt burdens, especially at the government level. As a result, we are experiencing the loosest monetary policy of all time today. Meanwhile, the valuation of the stock market, which is highly dependent on the suppression of the cost of capital, far exceeds the periods of the 1940s and 1970s. Using Robert Shiller’s cyclically adjusted price to earnings ratio as a gauge, we are at 38.3 times today. That is more than double what we saw during the most overvalued levels reached during those two decades. Even more significantly, the market cap of US stocks relative to nominal GDP is by far greater than any other time in history. The levels of overall debt are also materially higher. Total debt, including private and public, as a percentage of GDP is almost double the size of the 1940s and 1970s.”
Crescat go on to add further address the ‘transitory’ inflation argument or narrative:
“While some people like to say that the inflation rate will accelerate in steady fashion, we believe this line of thinking is utterly wrong. Macro forces are cyclical. As inflation gradually becomes the prevailing narrative, households and businesses act accordingly creating a vicious cycle that can result in surprising surges in the cost of living that ebb and flow. Let’s return to the 1970s case study.
From 1965 to 1980, the US economy experienced three inflationary waves that built on themselves becoming progressively larger as time went on. Note how CPI made “higher highs” and “higher lows” marking a persistent 15-year trend of a rising annualized inflation rate. This historic fact is exactly the opposite of what is implied by the popular “inflation-is-transitory” narrative today. That idea implicitly promotes a concept that inflationary cycles are short-term and mean reverting rather than long-term and trending. Those years were marked by fierce counter shifts in monetary and fiscal policies that repeatedly changed focus from fostering economic growth to strongly fighting inflation. As a result, financial markets experienced one of the most volatile boom-and-bust periods of history. At that time, the Fed was fortunate to be able to raise rates without triggering a debt crisis. This is a very different setup today.”
The 50 years of monetary debasement, trending exponentially now as most things end, is increasingly looking like von Mises ‘Crack-up-Boom’.
Ergon von Greyerz concluded his article as follows and we will post it in full on Sunday to mark this auspicious occasion:
“In the coming collapse of the monetary system, wealth preservation will be critical. Physical gold and silver has a proven record in history as the ultimate form of wealth preservation.
Measured in collapsing paper money, gold and silver will reach unthinkable levels.
In the next 5-10 years, precious metals will vastly outperform all asset classes in real terms.”