36% Crash Ahead for S&P500?
News
|
Posted 18/08/2021
|
10837
There is a sense of growing uncertainty in US equity markets despite, or maybe because of, their hitting all time highs this week amid growing concerns around the Fed’s next move and growth concerns. Last night saw a correction of nearly 1% ostensibly on the back of poor retail sales data joining a host of disappointing economic data potentially signalling weakness ahead.
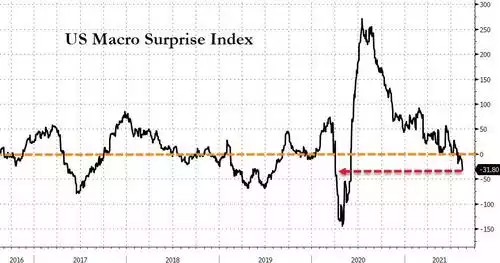
One of Macro Investor’s Raoul Pal’s favoured prints is the Bloomberg Macro Surprise Index and it is currently plunging deeper into negative territory. i.e. the ‘experts’ keep expecting better economic data than the reality prints.
Another measure of the market potentially getting it wrong is the ratio between the VVIX and VIX. Most readers will be familiar with the VIX being the CBOE’s Volatility Index measuring expected volatility in the S&P500 and generally seen as an index of fear. A less understood index is the VVIX which somewhat ironically is an index that measures the volatility of the volatility index or VIX. Whilst the current ‘everything’s awesome’ market has an understandably low VIX, the VVIX, arguably more traded by ‘smart money’ has been creeping higher. That stronger numerator and declining denominator resulted in a ratio at an historically significant high of 7.5 this week. Per the chart below you will note that each time it has reached such highs a large correction has soon followed:
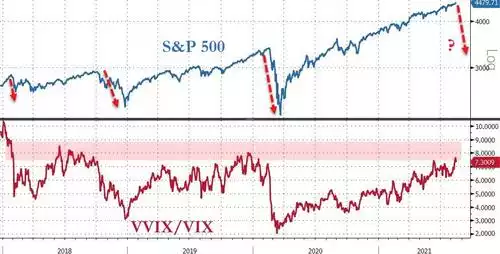
Last night saw the VIX surged to almost 19.5 and hence the ratio dropped to around 6.7 at the time of writing. This volatility comes after the S&P500 hitting a milestone ‘un-volatile’ 6 months in a row of positive price growth, an extraordinarily rare occurrence and one normally followed by a sizeable correction.
The VVIX is likely telling us is that a market this extended at a time when its major driver, Fed monetary stimulus, is looking like possibly ‘shocking’ the market through tapering is prone to a big shock itself. And when we say ‘extended’ check out the following from Real Investment Advice’s Lance Roberts:
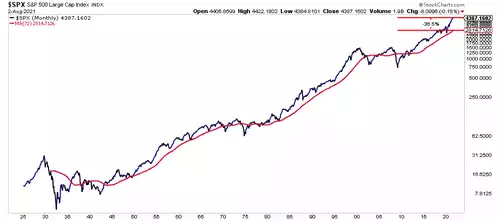
“This is also where investors should be paying attention to the ‘risk’ they are taking on. As shown, there are few points in history where the index, monthly, is this extended, deviated, and bullish.
There have only been 6-previous points in history where markets were simultaneously this extended, bullish, and overbought. Each of those periods marked more historical performance peaks – 1929, 1937, 1946, 1957, 1987, 1999.
Importantly, the 72-month moving average has acted as long-term running support for the market going back to 1925. Violations of that moving average are rare and only occur during “mean-reverting” bear markets. Currently, a correction to the 72-month moving average would require a 36.5% decline.” 36.5%!
‘But the market is more than the Fed stimulus’ you say. No doubt there has been a strong rebound out of the depths of the initial COVIC recession but it is just that, a rebound. There is simply no getting away from the correlation between the sharemarket and monetary stimulus charted below.
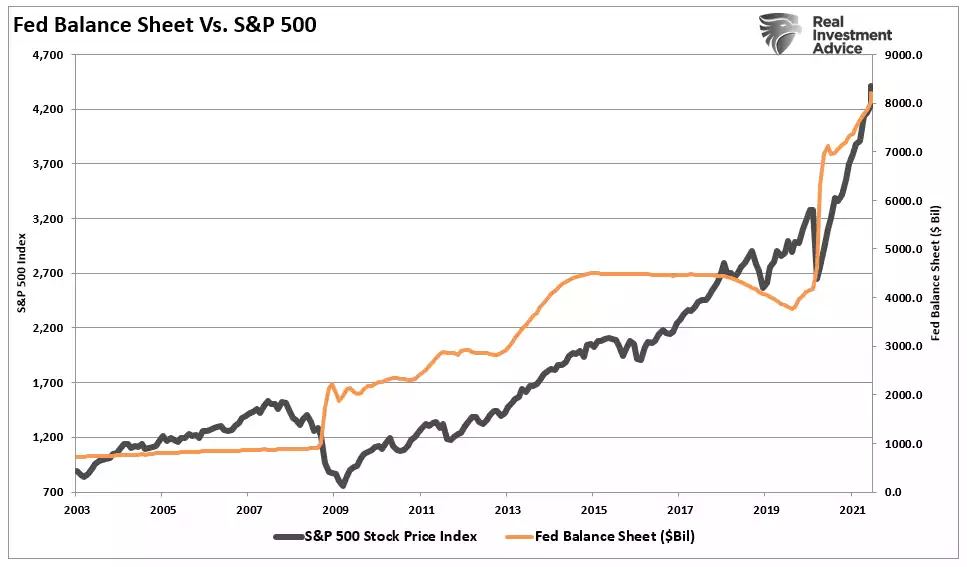
And so, with the annual meeting of central bankers at Jackson Hole just next week where such ‘big announcements’ are often made, and after the headlines of the big NFP payrolls, CPI and PPI prints the Fed may feel forced to indeed taper their QE program and try to pull back that exponential orange line above. That same chart tells you what happened each time they tried that before and at times where the market was less extended than it currently is.
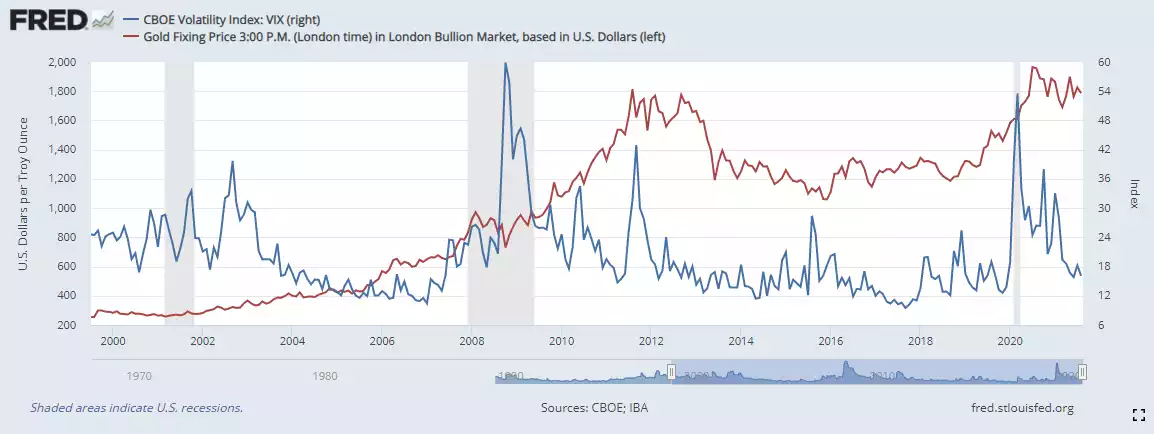
Gold loves a high and climbing VIX as you can clearly see in the chart below. The ‘all in’ crowd don’t believe the Fed will be brave enough to taper and hence a volatile shock would likely ensue. What’s missing in the chart below for Aussie investors is that such shocks often also see a USD surge and hence, as happened last night with gold almost steady in USD but considerably stronger in AUD terms, the AUD drops and adds further gains to the price in local terms.
Of course if the Fed doesn’t taper, the growing concern of currency debasement and bubble fears around the Fed being ‘behind the curve’ could just as likely see more money flow into gold as a hedge. The Fed’s dilemma is gold’s each way bet.
