2 Graphs you must see
News
|
Posted 08/12/2014
|
4239
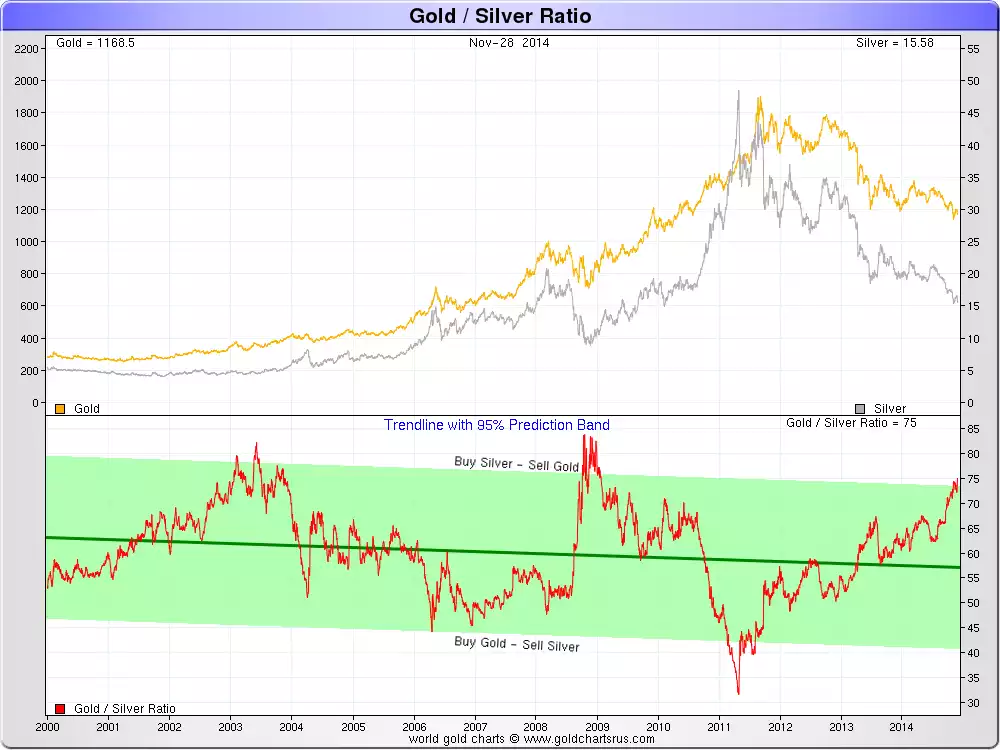
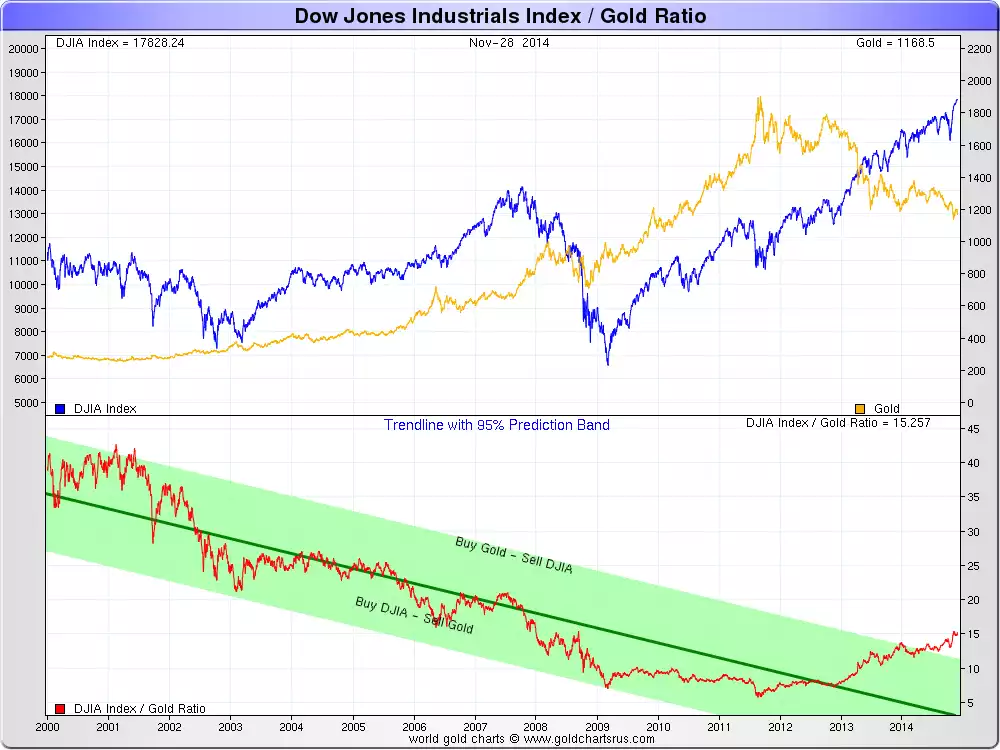
You will note in our daily emails recently we have added the Gold:Silver Ratio to the daily price movements. Many customers watch this religiously and trade accordingly. For new comers this ratio over 1000’s of years has averaged about 18:1, over the last couple of centuries about 35:1 and currently sits at around 73:1! The graph below illustrates what’s happened over the last 14 years and is self explanatory. Another index people watch is the Dow Jones Index : Gold ratio. Whilst the 2nd graph below is also self explanatory, consider that the DJIA is arguably at record highs purely because of the money printing stimulus of QE, which in itself is precisely the reason why many own gold as all this free money and debt can only end badly for paper assets – making hard assets such as gold and silver the perfect insurance.