“All Time High Fragility” – Handle with Care
News
|
Posted 14/09/2020
|
12603
There is a tonne of investor cash looking for a home in markets at a time where there are no clear safe bets. The central banks’ low interest rate policy and increasing fear of holding cash in a bank has formed a predicament for those in this ‘situation’.
Bank of America Merrill Lynch estimate that money market funds hold over $4.5t in cash, private equity cash at $1.5t and US corporates having raised $3t of funds through investment grade and junk bond issuance ($1.8t), bank loans ($1.0t), and equity raisings ($0.2t).
The other massive dynamic in markets right now is the behemoth that is the passive ETF funds. These funds, the likes of Vanguard etc, were born of the ‘realisation’ that managed funds were rarely outperforming the broader market index and charged expensive fees for that result. Thus the birth of passive funds that didn’t even try to guess and had low fees accordingly. The graph below tells the story of the outflows from active funds compared to inflows to passive.

The problem is, as we discussed recently, that this compounds the concentration problem within the US equities market as these funds are often weighted according to each equity’s index weight, perversely compounding that very issue. We’ve spoken before about how the 5 FAAMG’s account for nearly a quarter of the S&P500 and furthermore just the top 10 shares (again dominated by tech stocks) now account for nearly half of value of the entire 500 companies comprising the index.

That is an eye watering level of concentration and one not seen since the dot.com bubble:

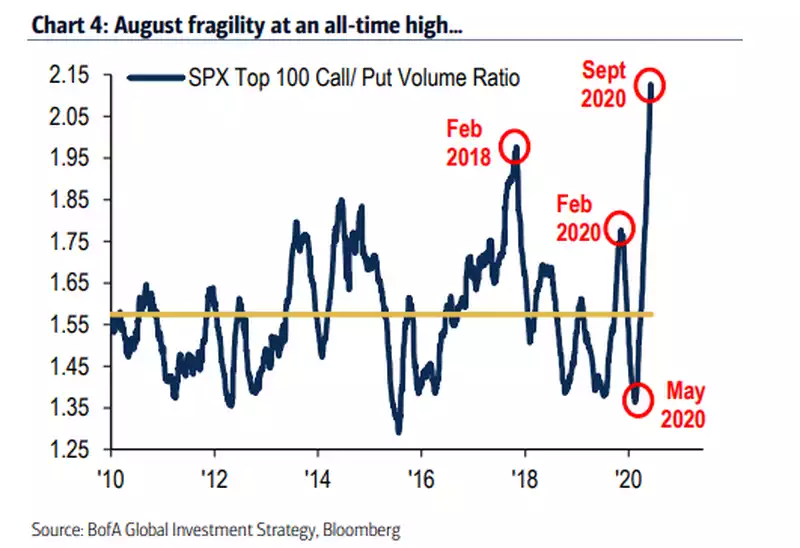
Something had to give and last week we saw the tech heavy NASDAQ see its fastest falls ever before easing. The danger of all that passive money in a concentrated position is of course momentum. Momentum has been awesome for these shares since the bottom of the February crash. It has been a self-fulfilling, self-reinforcing rally for the record books. However last month we saw that culminate in a massively asymmetric positioning leading to what BofAML called all time high fragility measured by the ratio of Call/Put options volume. Ears were well and truly pinned right back as you can see from the chart below and that normally plays out one way. You can see previous spikes align with previous major corrections.
And so the multi trillion dollar question remains… where will all that cash go? If this correction continues, all that passive money will follow it down the hole. The smart money will be looking for the safe haven that was getting forgotten about as the ‘tech stocks to da moon’ narrative ran to that peak.
You can see in the charts below how the inflows to gold and silver ETF’s etc have eased off just recently as has the price. That is a healthy pause for something that was running too hot too quickly. For some it was a time to take some profit, for the other side it was a time to buy the dip. Balance is key in these uncertain times and taking some profit along the way is never a bad thing. Long term holders are stepping back and looking at this epic macro setup, happy to hold and maybe add on the dips. Everyone is different and no one knows what will really happen. As with anything fragile…. Handle with Care and use some financial bubble wrap.

