$2000 Gold & ATH – What comes next?
News
|
Posted 21/06/2019
|
12491
Yesterday saw news aflutter with gold cracking AUD2000/oz with (belated) headlines of a new All Time High for the metal in local terms. In USD terms we saw a 6 year high yesterday reaching $1392/oz…. perilously close to cracking the elusive $1400.
Silver, which has lagged gold now since 2011, got left behind pushing the Gold Silver Ratio out to an eye watering 90.7 at one stage. That is the highest ratio in over 25 years! History shows that a high GSR tends to revert as gold takes off. When gold took off from the GFC to 2011 to reach its previous high of $1900 the GSR plummeted to just 30:1. That rally saw gold rise 105% and silver slingshot past it, up 407% as the ratio dropped.
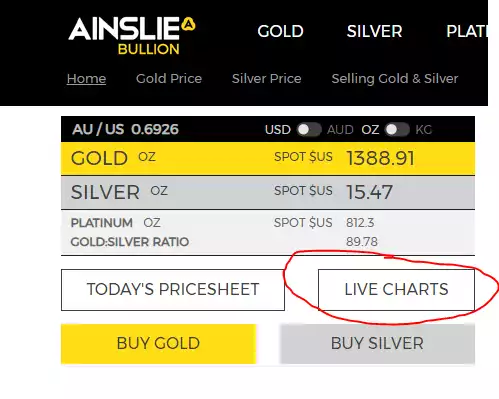
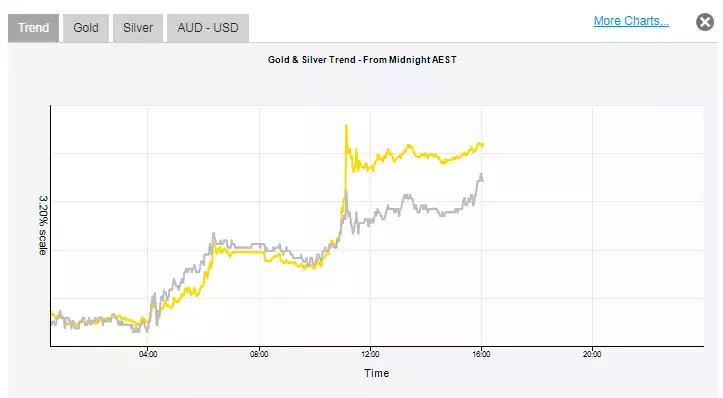
We maybe saw that start to play out a little yesterday when silver staged a late catch up rally and the GSR dropped back below 90. You may not know we have a neat live trend chart on our homepage. This tool gives you a daily view of gold and silver’s relative performance to watch during a day.
Looking at yesterday (below) you can see how gold took off around 11am leaving silver in its wake and then silver played catch up (in percentage terms) right toward the end of the day. Clicking on the AUD/USD tab shows you whether movement is because of the USD spot price or the AUD/USD exchange rate (given gold has 2 ‘masters’ for us).
Of course we have a full range of charts in AUD or USD terms as well if you click on Gold Price or Silver Price in the header of the main page. Likewise the Ainslie Crypto website has all the crypto charts for you too.
So the big question on many people’s lips is whether this is a sustainable rally. Presciently Crisis & Opportunity’s Greg Canavan wrote this for subscribers on Wednesday (initially in the context of more big names calling for a rally in gold):
““Another big player to get bullish on gold is Paul Tudor Jones, one of the original hedge fund titans. In a recent Bloomberg interview, he said:
‘The best trade is going to be gold. If I have to pick my favourite for the next 12-24 months it probably would be gold. I think gold goes beyond $1,400... it goes to $1,700 rather quickly. It has everything going for it in a world where rates are conceivably going to zero in the United States.
‘Remember we've had 75 years of expanding globalization and trade, and we built the machine around the belief that's the way the world's going to be. Now all of a sudden it's stopped, and we are reversing that.
‘When you break something like that, the consequences won't be seen at first, it might be seen one year, two years, three years later. That would make one think that it's possible that we go into a recession. That would make one think that rates in the US go back toward the zero bound and in the course of that situation, gold is going to scream.’
Let me show you a longer-term chart of gold to put those comments into perspective. As you can see below, gold has been trading in a massive range for nearly six years.
SIX YEARS!
That’s six years of rallying, correcting, and rallying again…only now, in 2019, to be back at 2018, 2016, and 2013 levels.
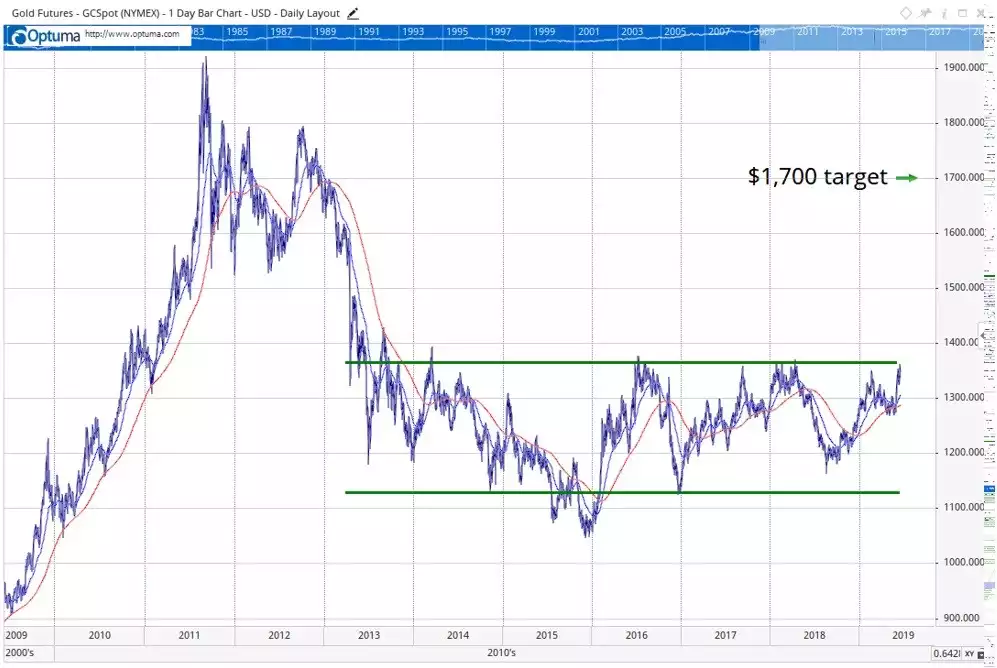
But I believe the long wait and the ‘going nowhere’ will be worthwhile.
You see, from a technical perspective, the longer a stock or an asset price trades within a range, the more power it builds for an eventual break out. If gold breaks out to the upside, then I can see Paul Tudor Jones’ target of US$1,700 being reached very quickly.”
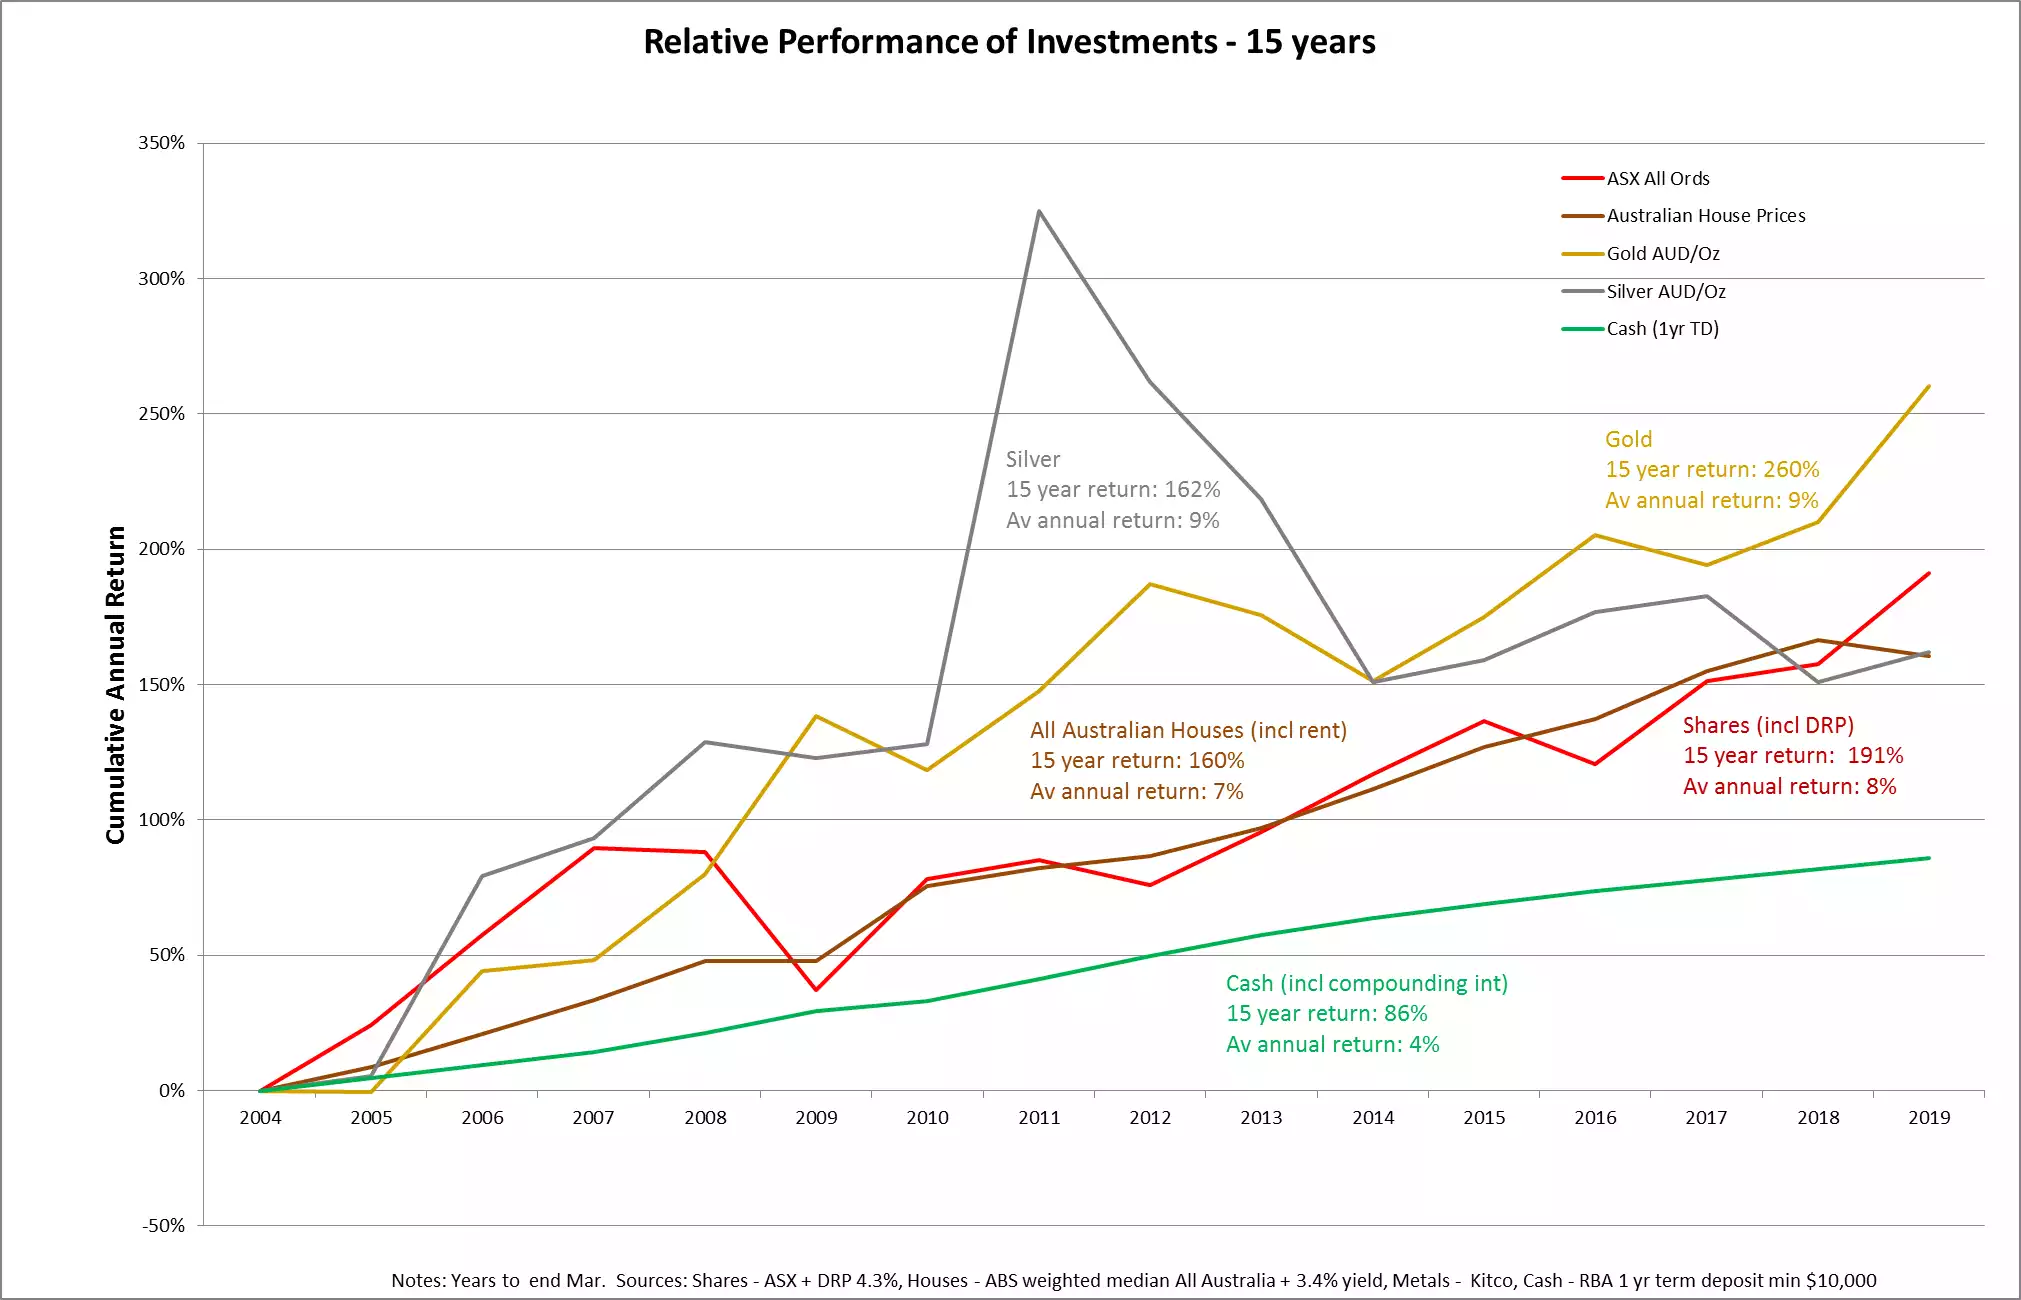
On a final point, with the release of the first quarter 2019 house prices by the Australian Bureau of Statistic on Tuesday we have updated our 15 year comparison of Aussie investments to March 2019. Remember this chart removes the argument that ‘gold doesn’t yield’ by adding (and compounding) dividend reinvestment to shares, rental yield to property, and interest to cash term deposits. This year we have moved to make this more generalised for all our readers by changing Brisbane house prices to all Australian housing, both attached and detached. As you can see, despite the ‘gold’s a pet rock / dead investment’ argument, gold has been the best performer over the last 15 years. As one would expect given that outlined above, silver has dropped over the last couple of years to ‘only’ be directly comparable to shares and property. Its time, as you can clearly see the results of in 2011, will come again.
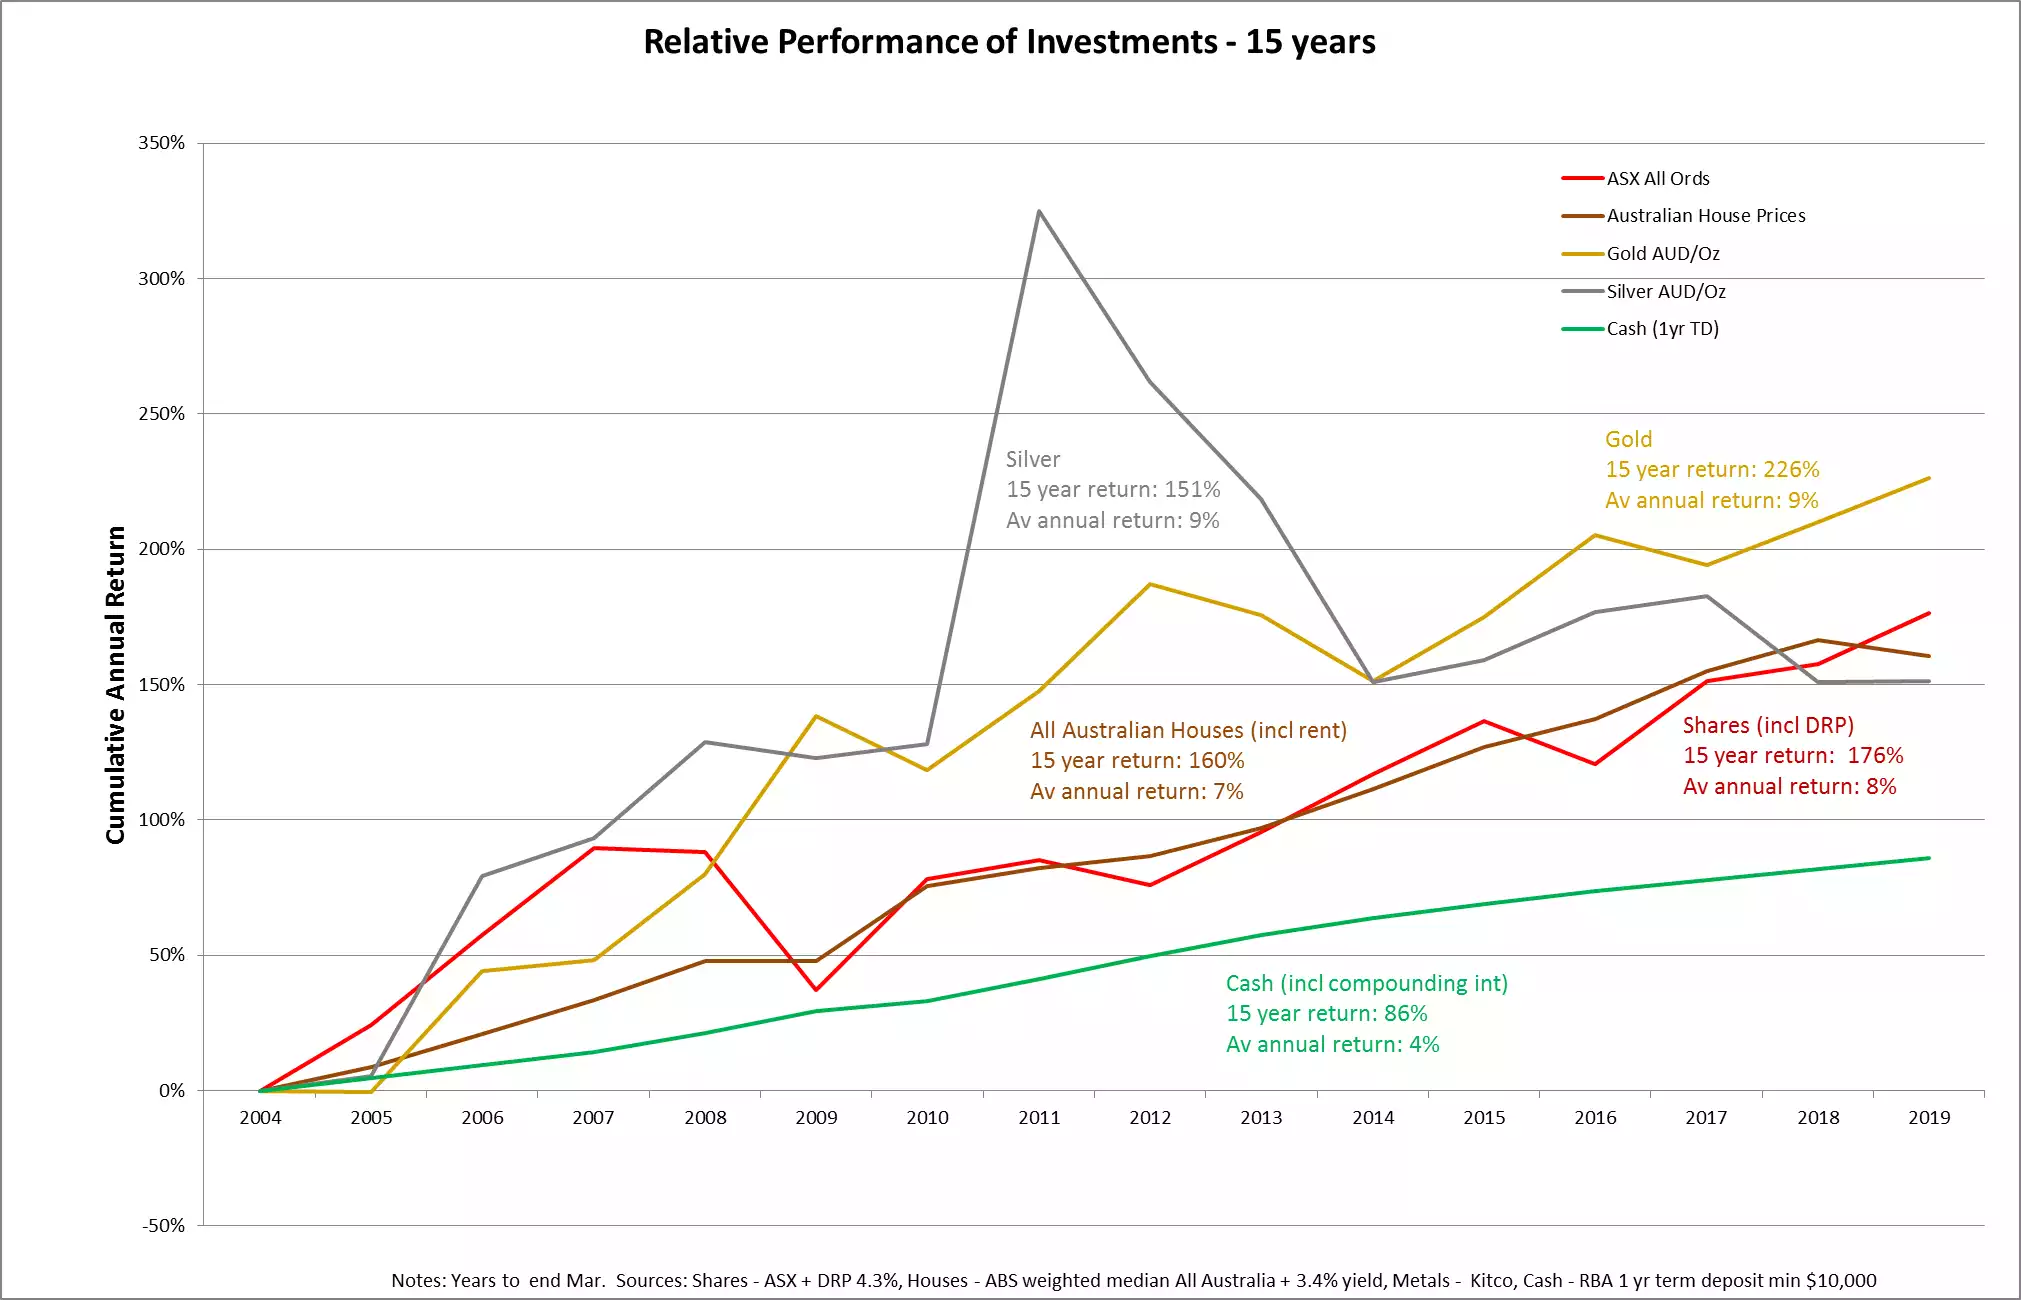
This chart (comparing all 5 to the end March 2019 each year) is now nearly a full quarter old. If we change 2019 to be to today (21June and generously assume no more deterioration in property or bank interest), it looks like that below. You can see gold and silver’s latest rally starting to play out.
Now just remember, that whilst we are at an all time high in gold in AUD terms, we still have the calls for USD1700 to yet play out. Exciting stuff.