Macro and Global Liquidity Analysis: Gold, Silver, and Bitcoin - April 2024
News
|
Posted 26/04/2024
|
819
Today the Ainslie Research team brings you the latest monthly update on where we are in the Global Macro Cycle, driven by the Global Liquidity Cycle, and the implications for Gold, Silver, and Bitcoin. This summary highlights the key charts that were discussed with our expert panel on Tuesday. We encourage you to watch the recorded video of the presentation in full for the detailed explanations.
Where are we currently in the Global Macro Cycle?
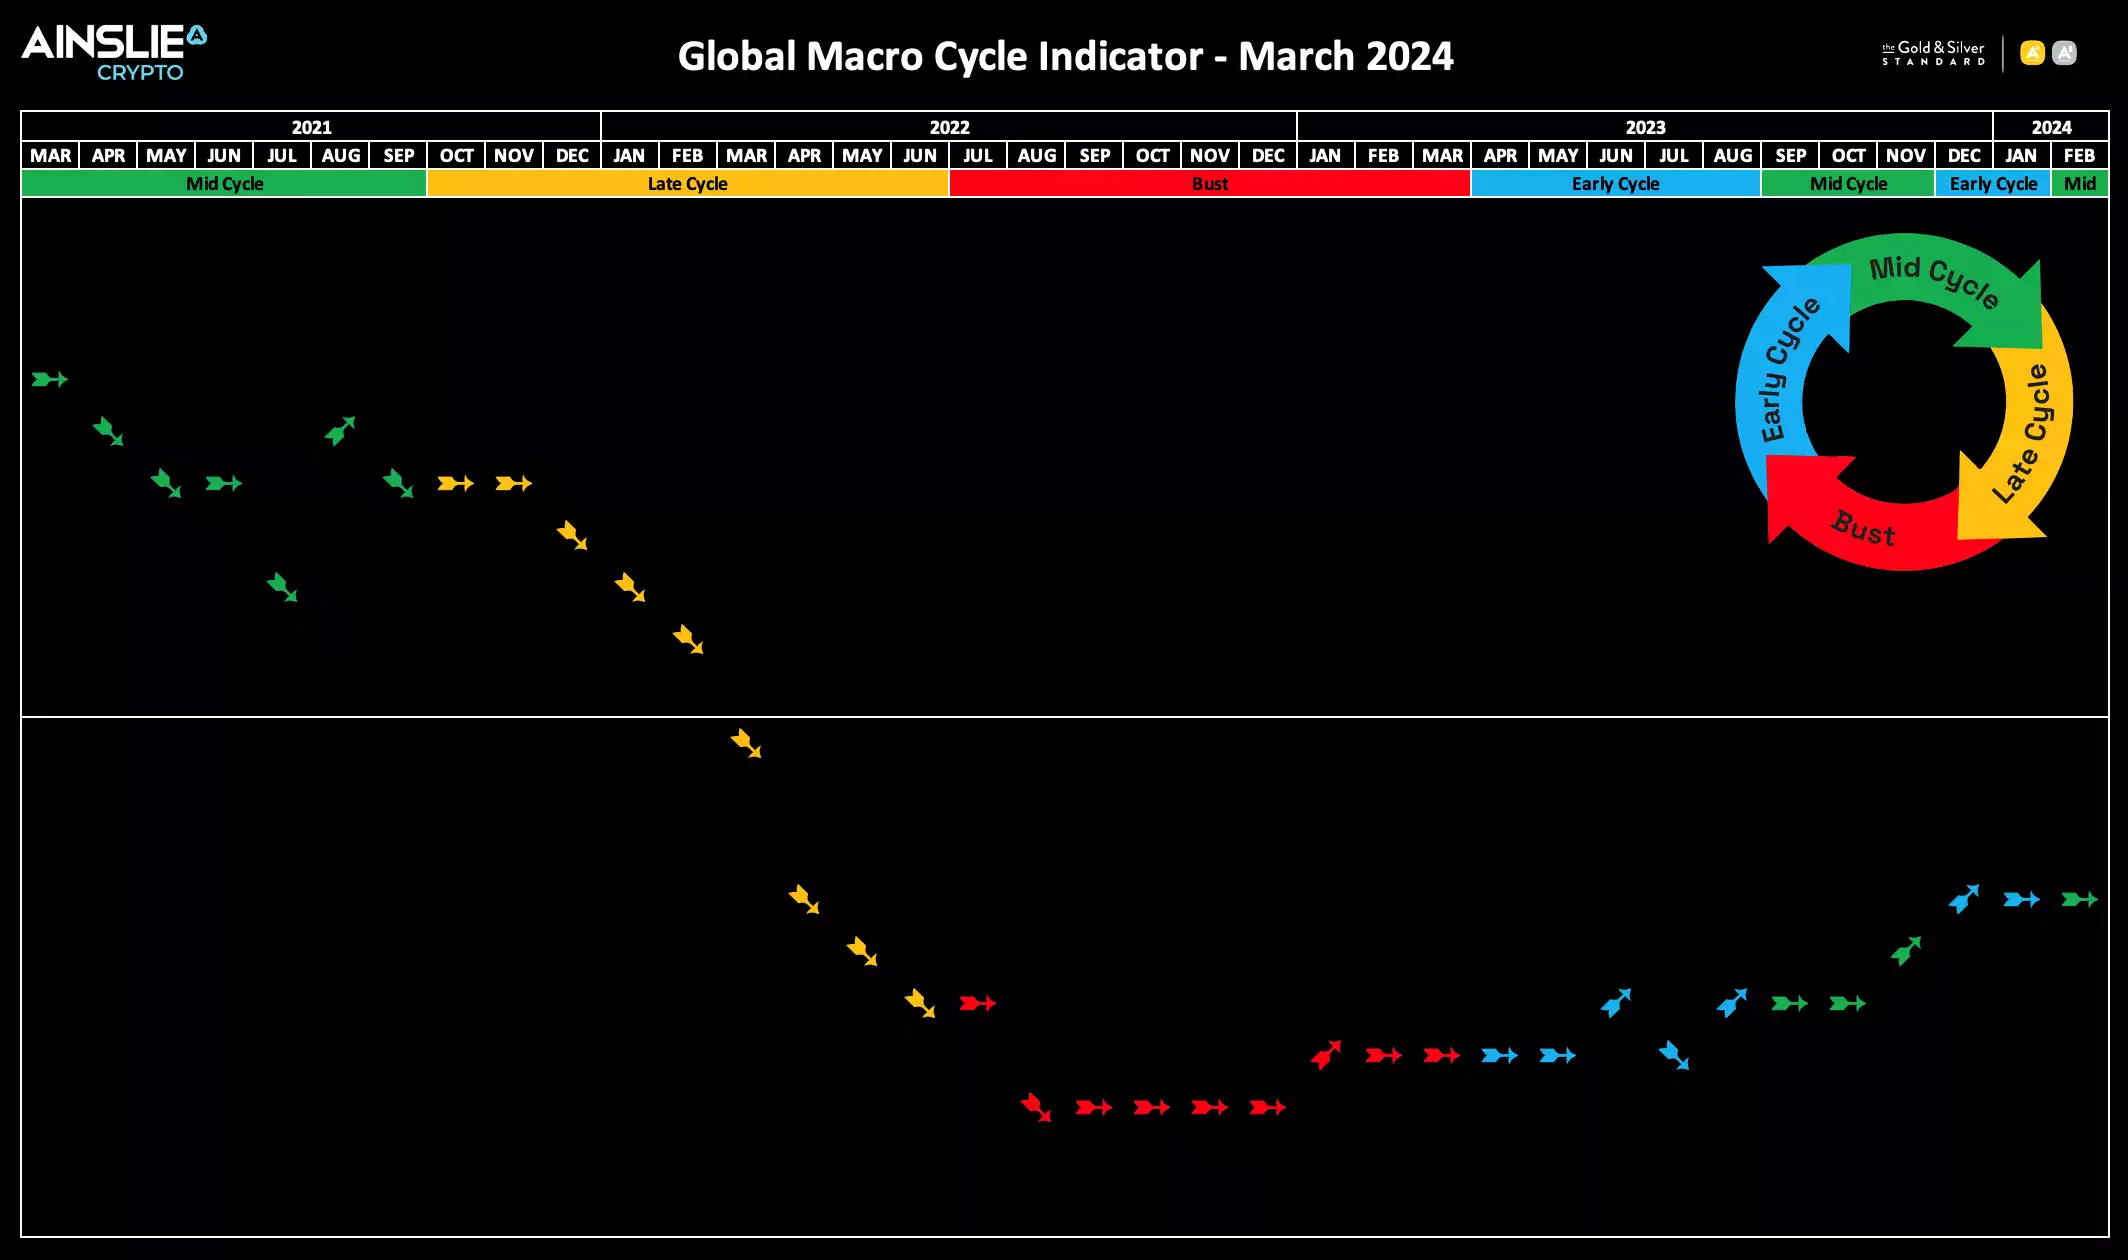
We switched back into the Mid Cycle phase of the Global Macro Cycle on the back on continued strength in the global economy last month, and we remain there on the latest data for April. We are still well below the halfway line however, indicating there is plenty of runway left for the upward momentum to continue.
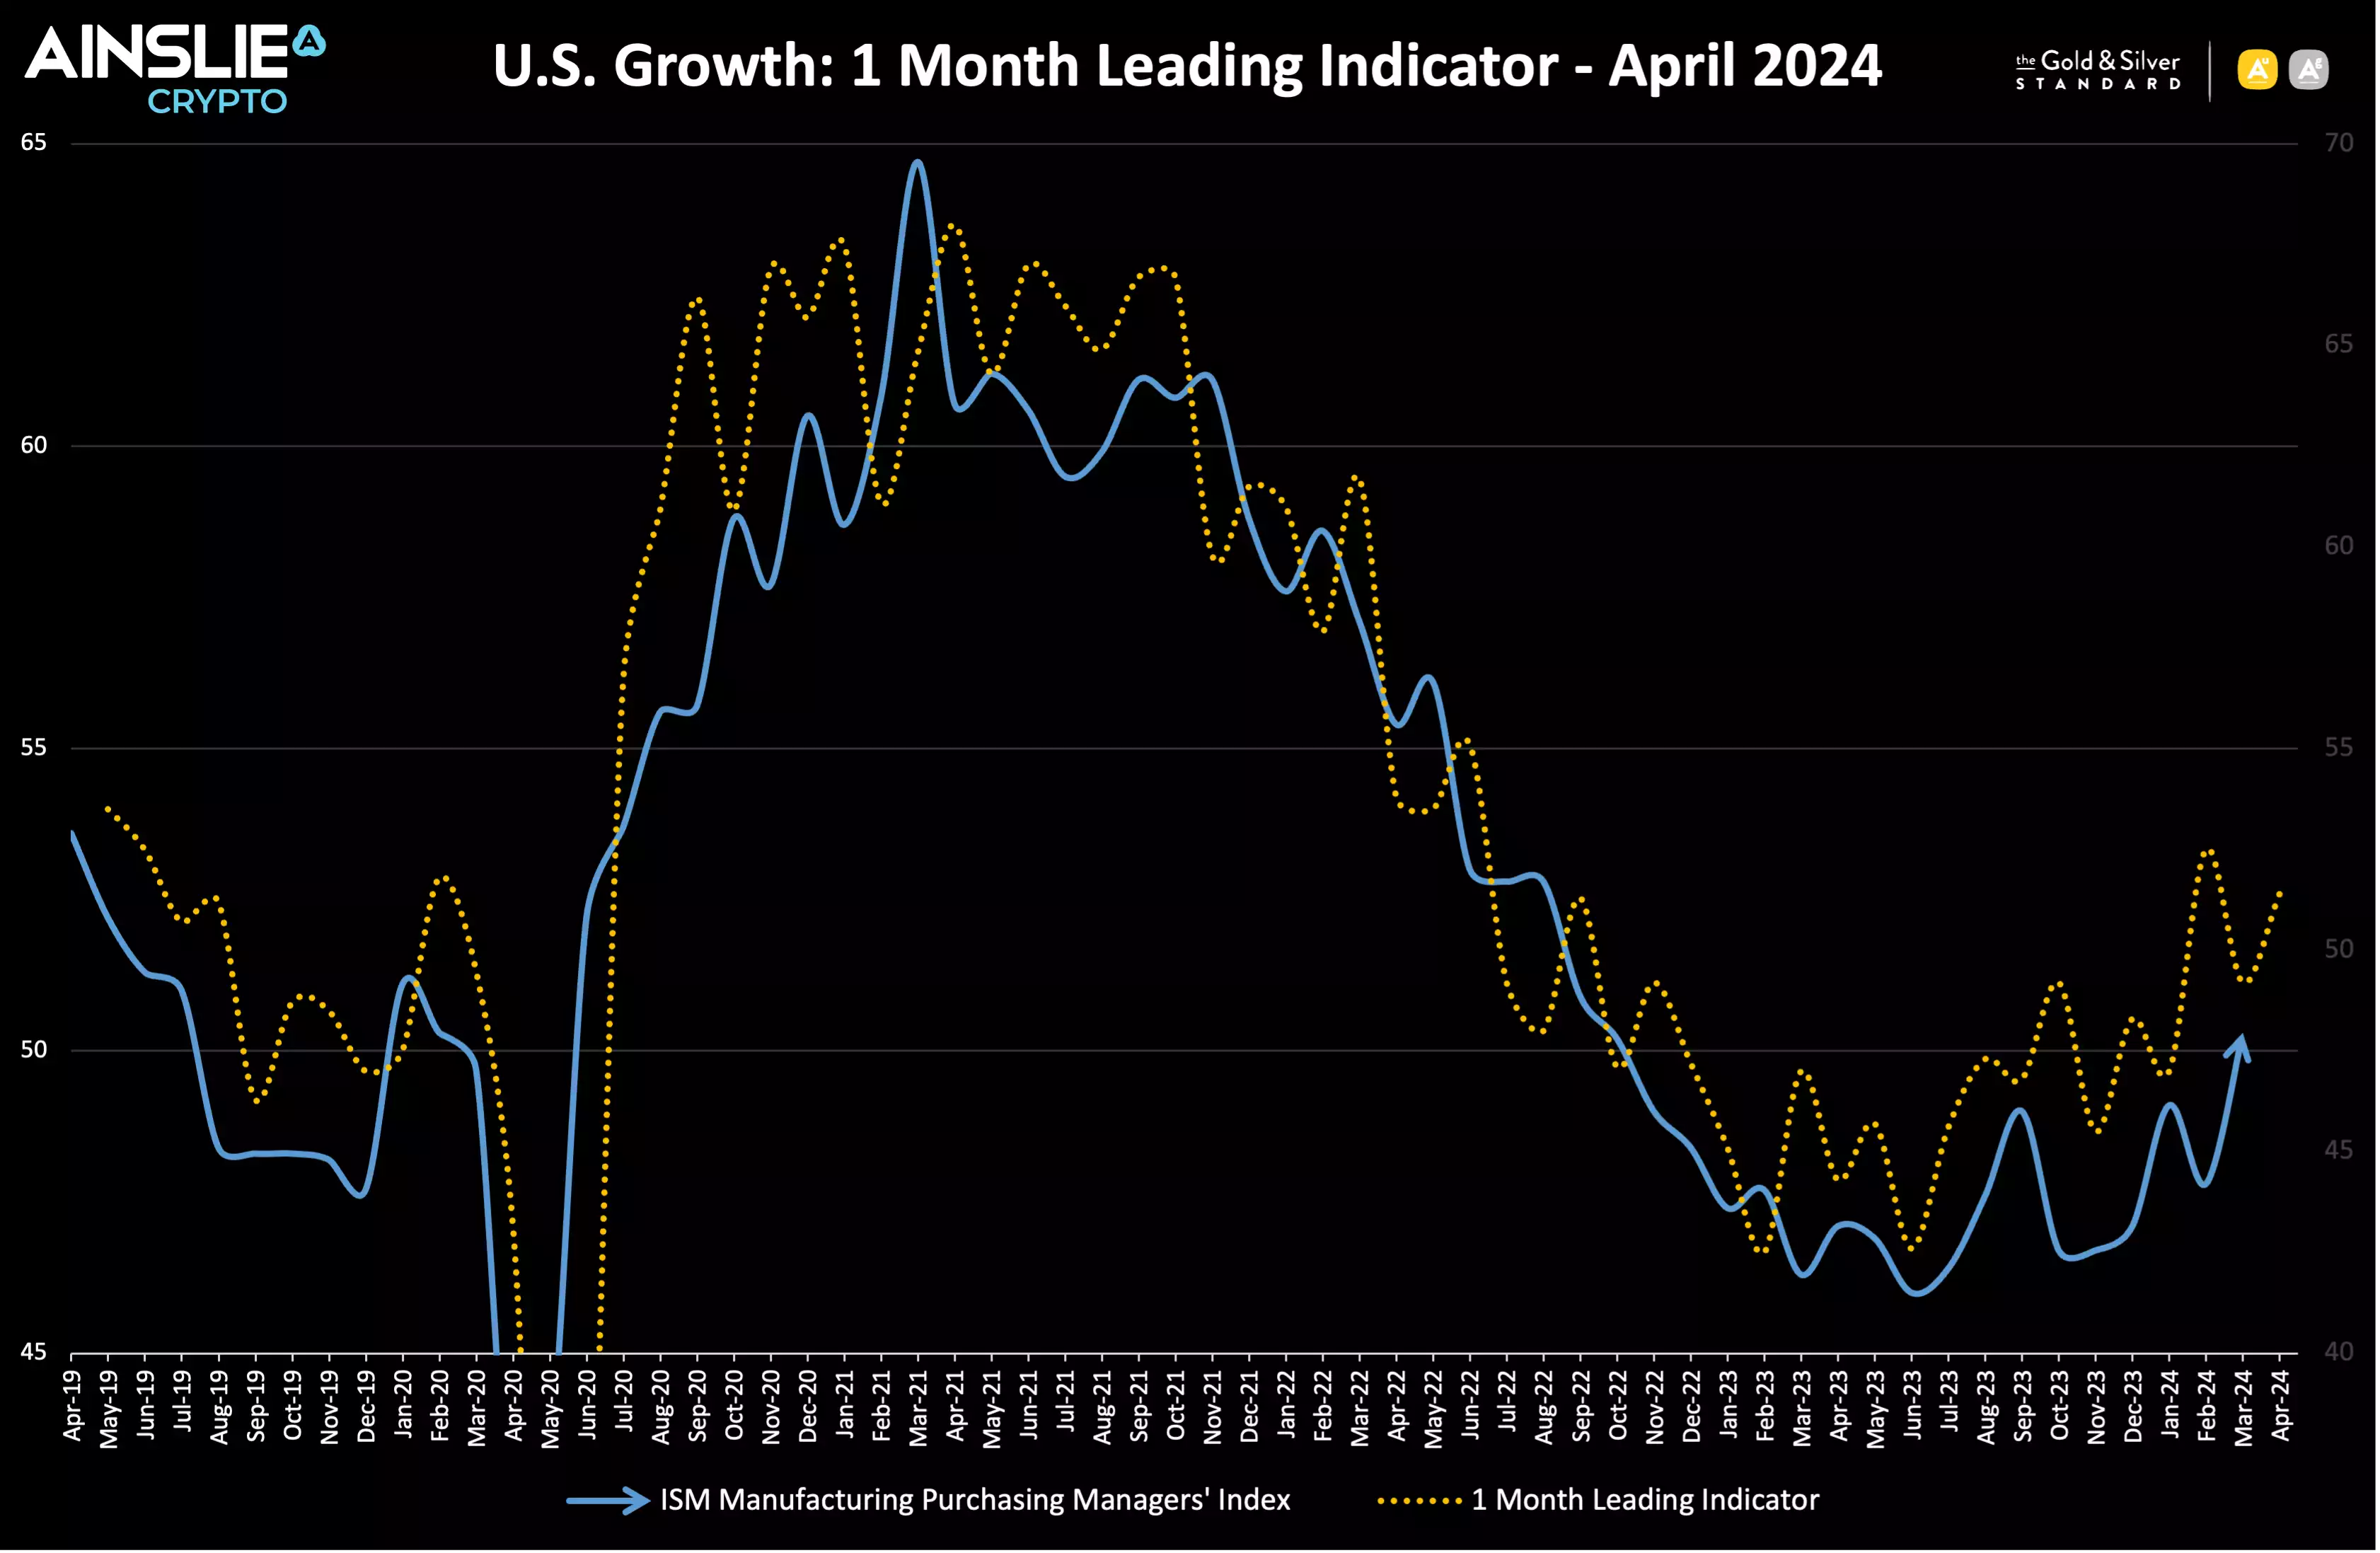
This is consistent with what we are seeing in terms of economic growth in the U.S., as evidenced by the ISM. We finally broke back above 50 and into expansionary territory for April…
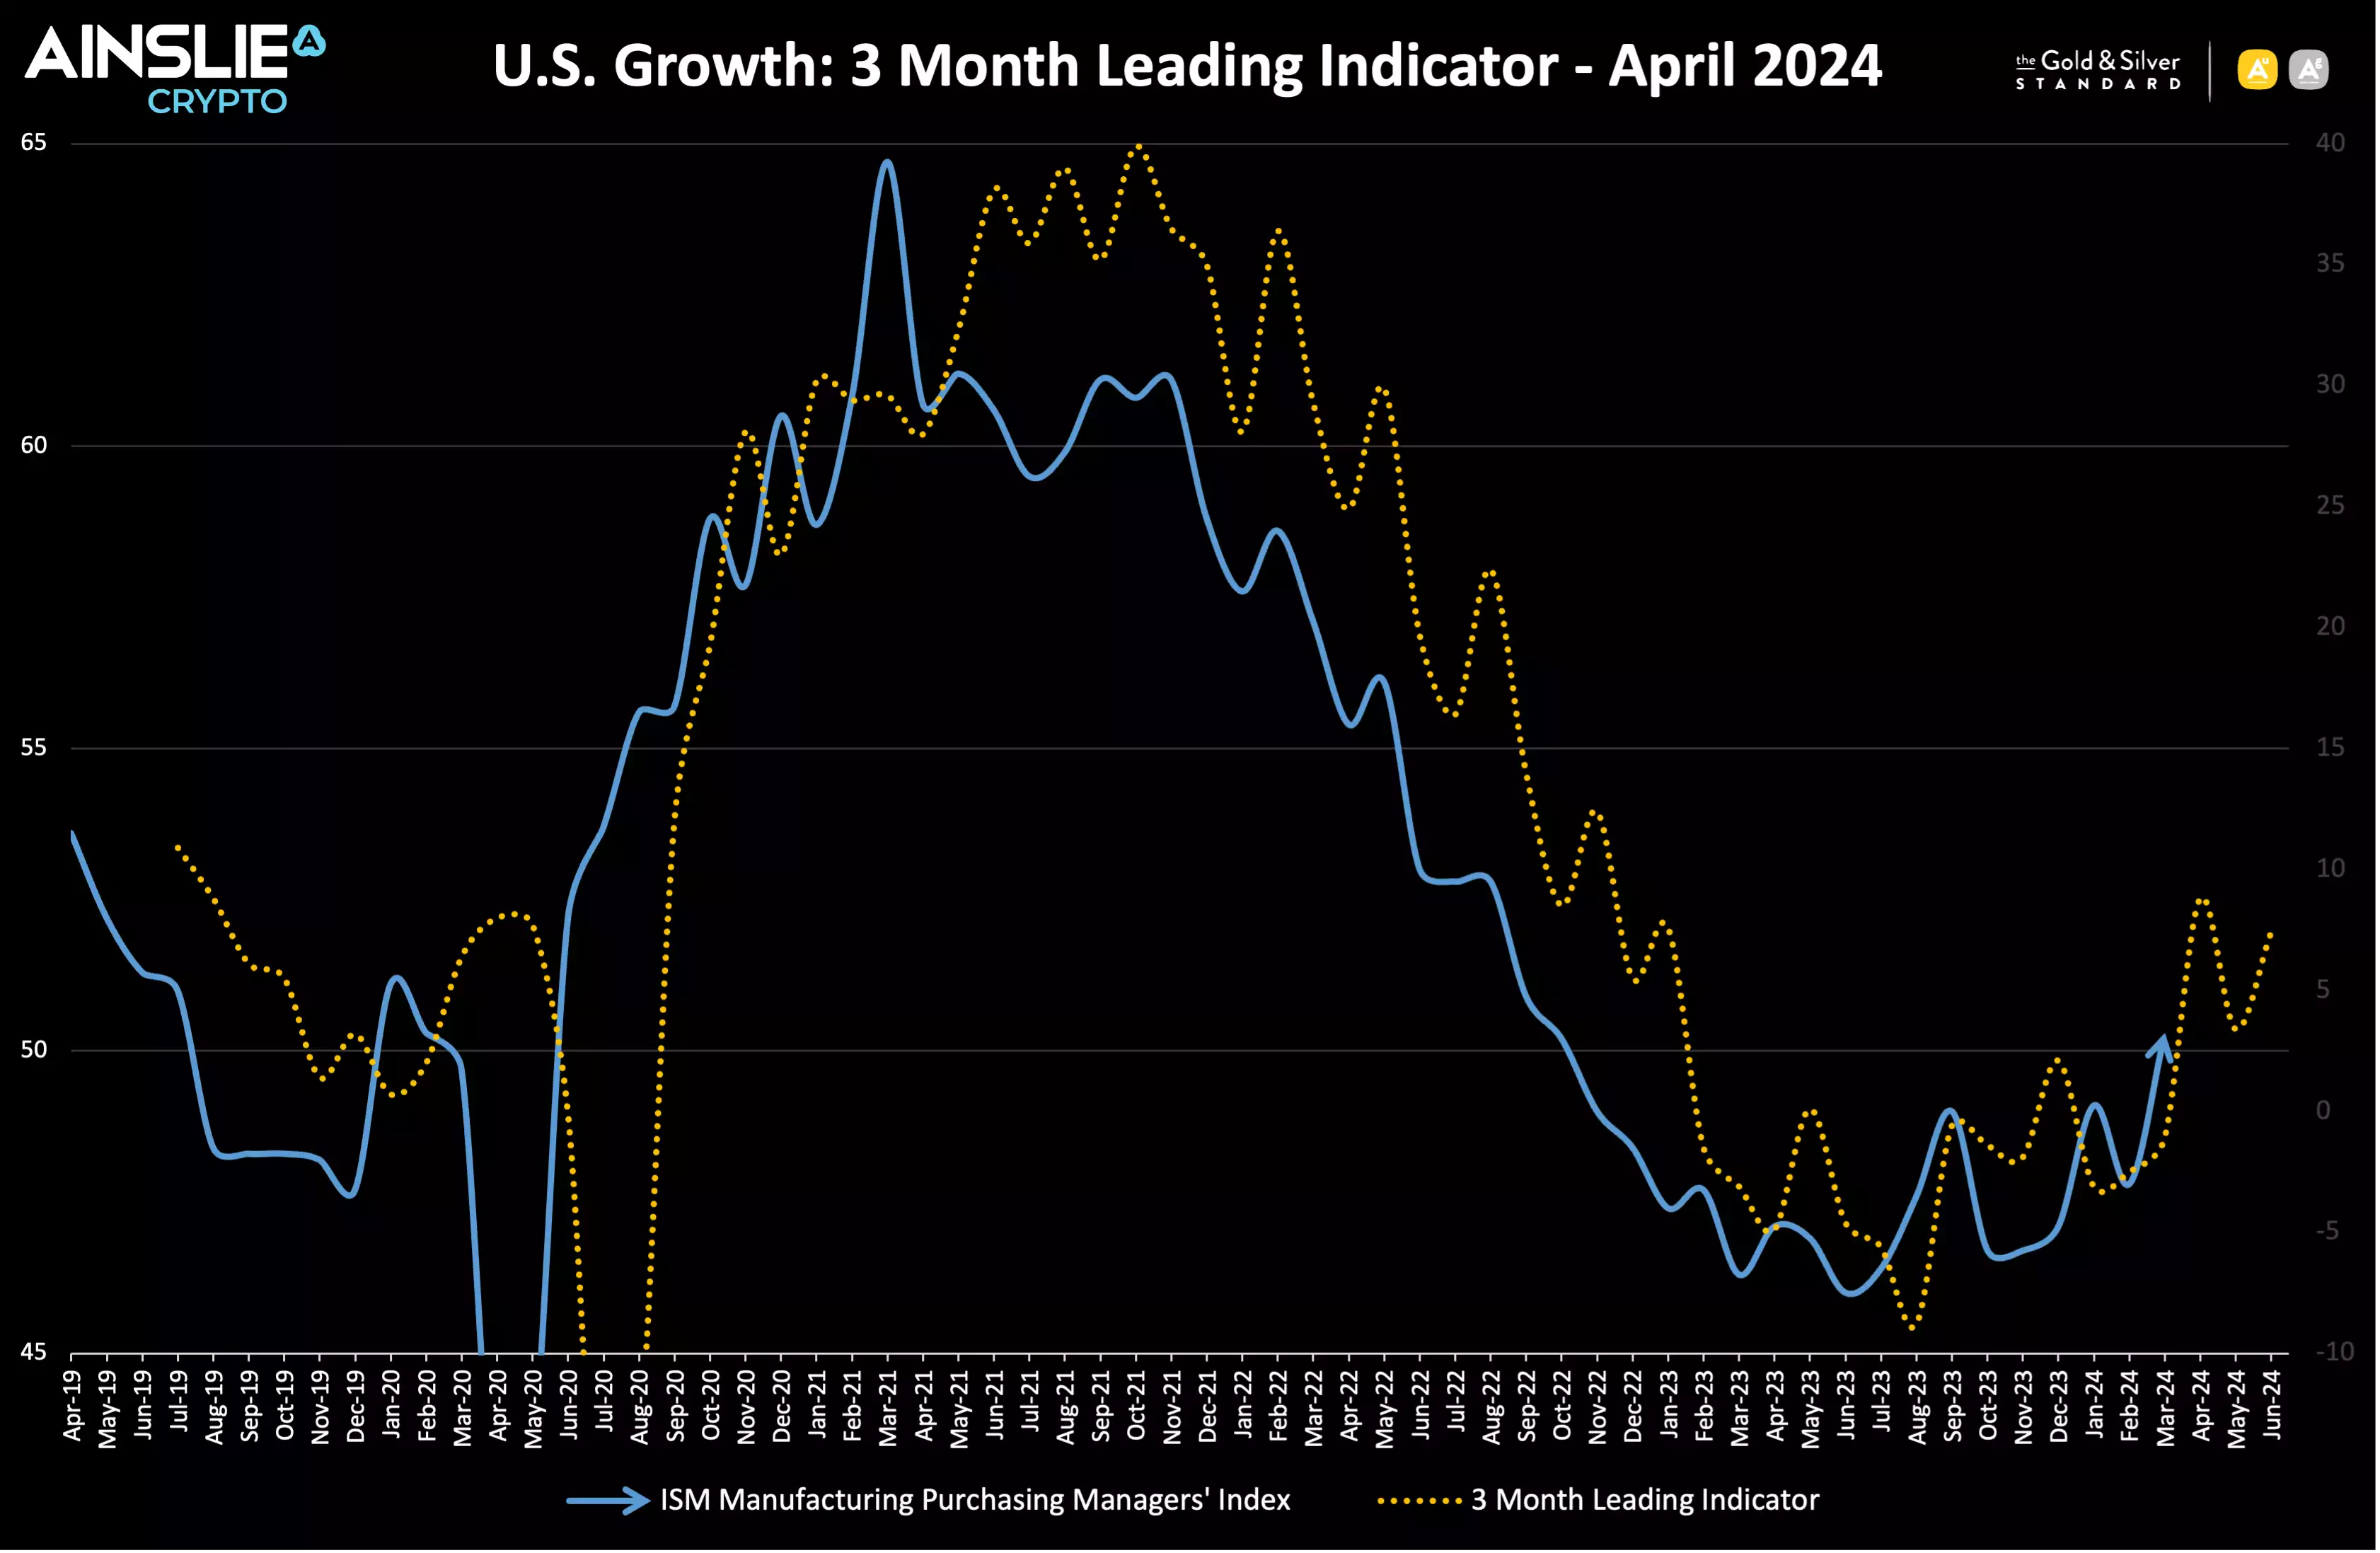
and the forward-looking indicator over the next 3 months indicates we have passed the bottom of the cycle and can expect further gains ahead.
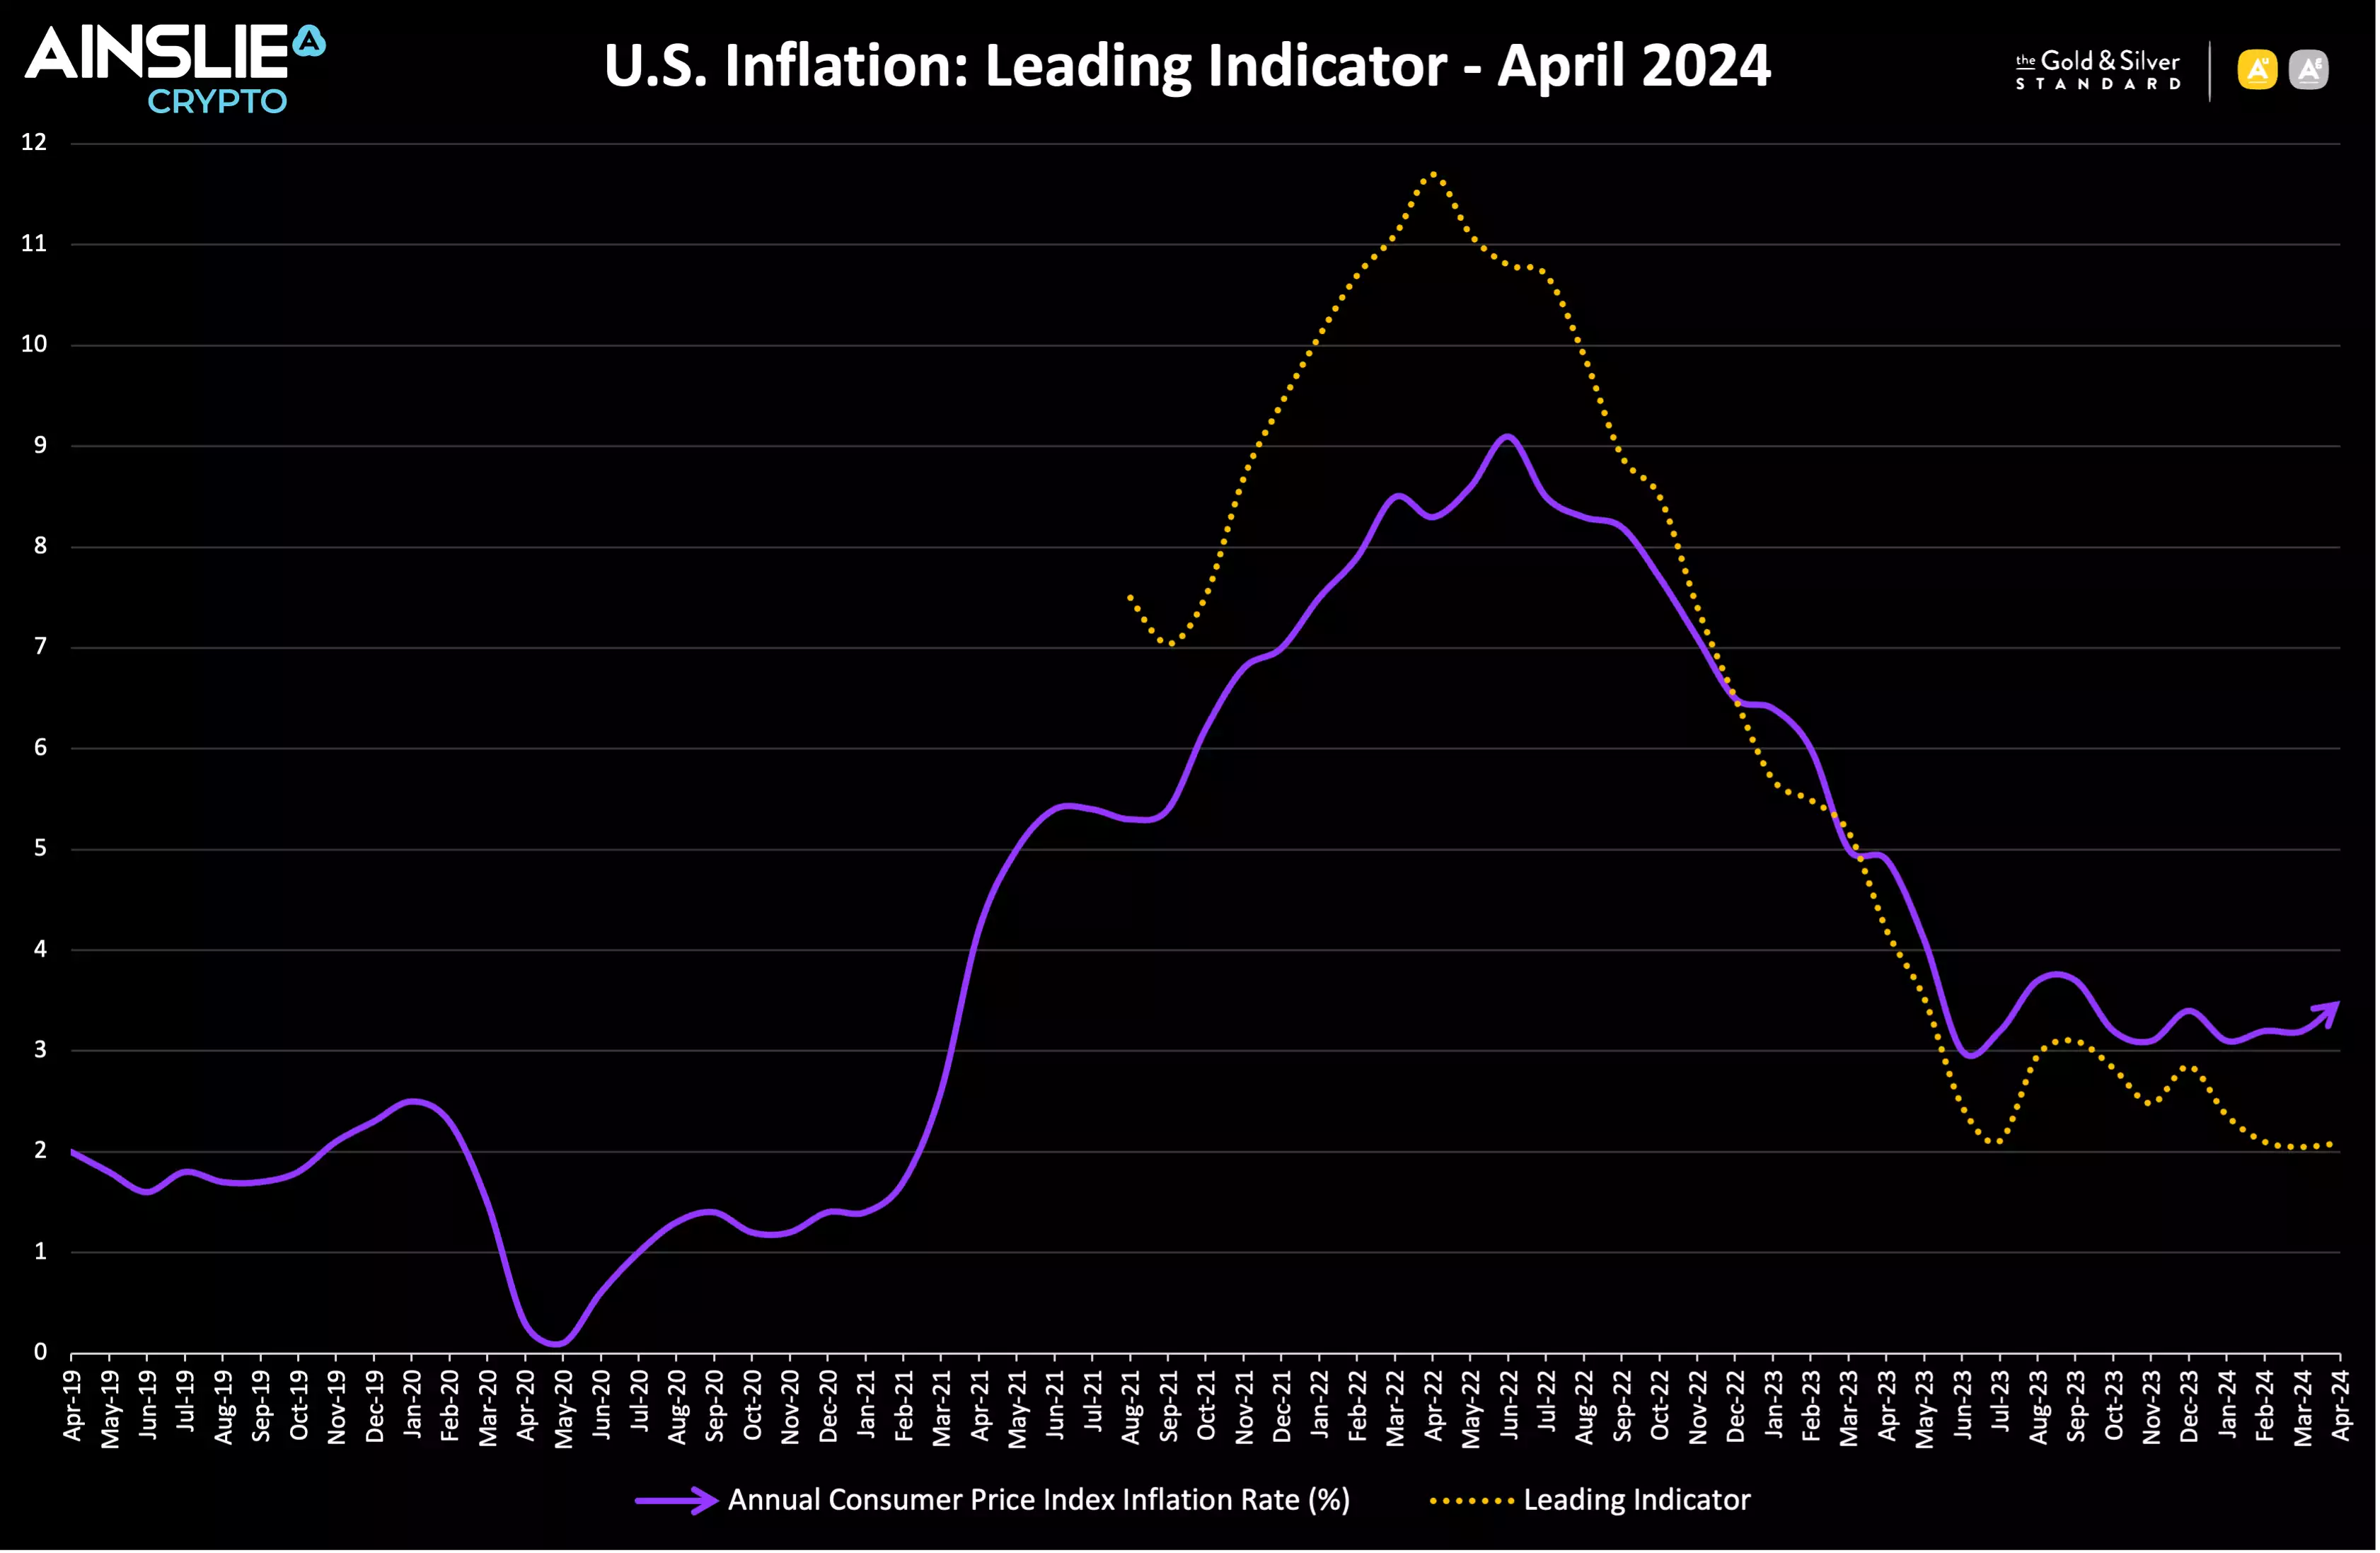
In terms of U.S. inflation, our leading indicator shows that the lagging government reported rate continues to remain higher than the real-time data, so there is no strong upward pressure on the rate expected over the next few months. The leading indicator suggests that the real rate of inflation is sitting around 2%, which is within the Federal Reserve’s stated target range. Rhetoric from the Fed has backed away from rate cuts recently, however the risk of further rate rises from here remains low while inflation remains stable.
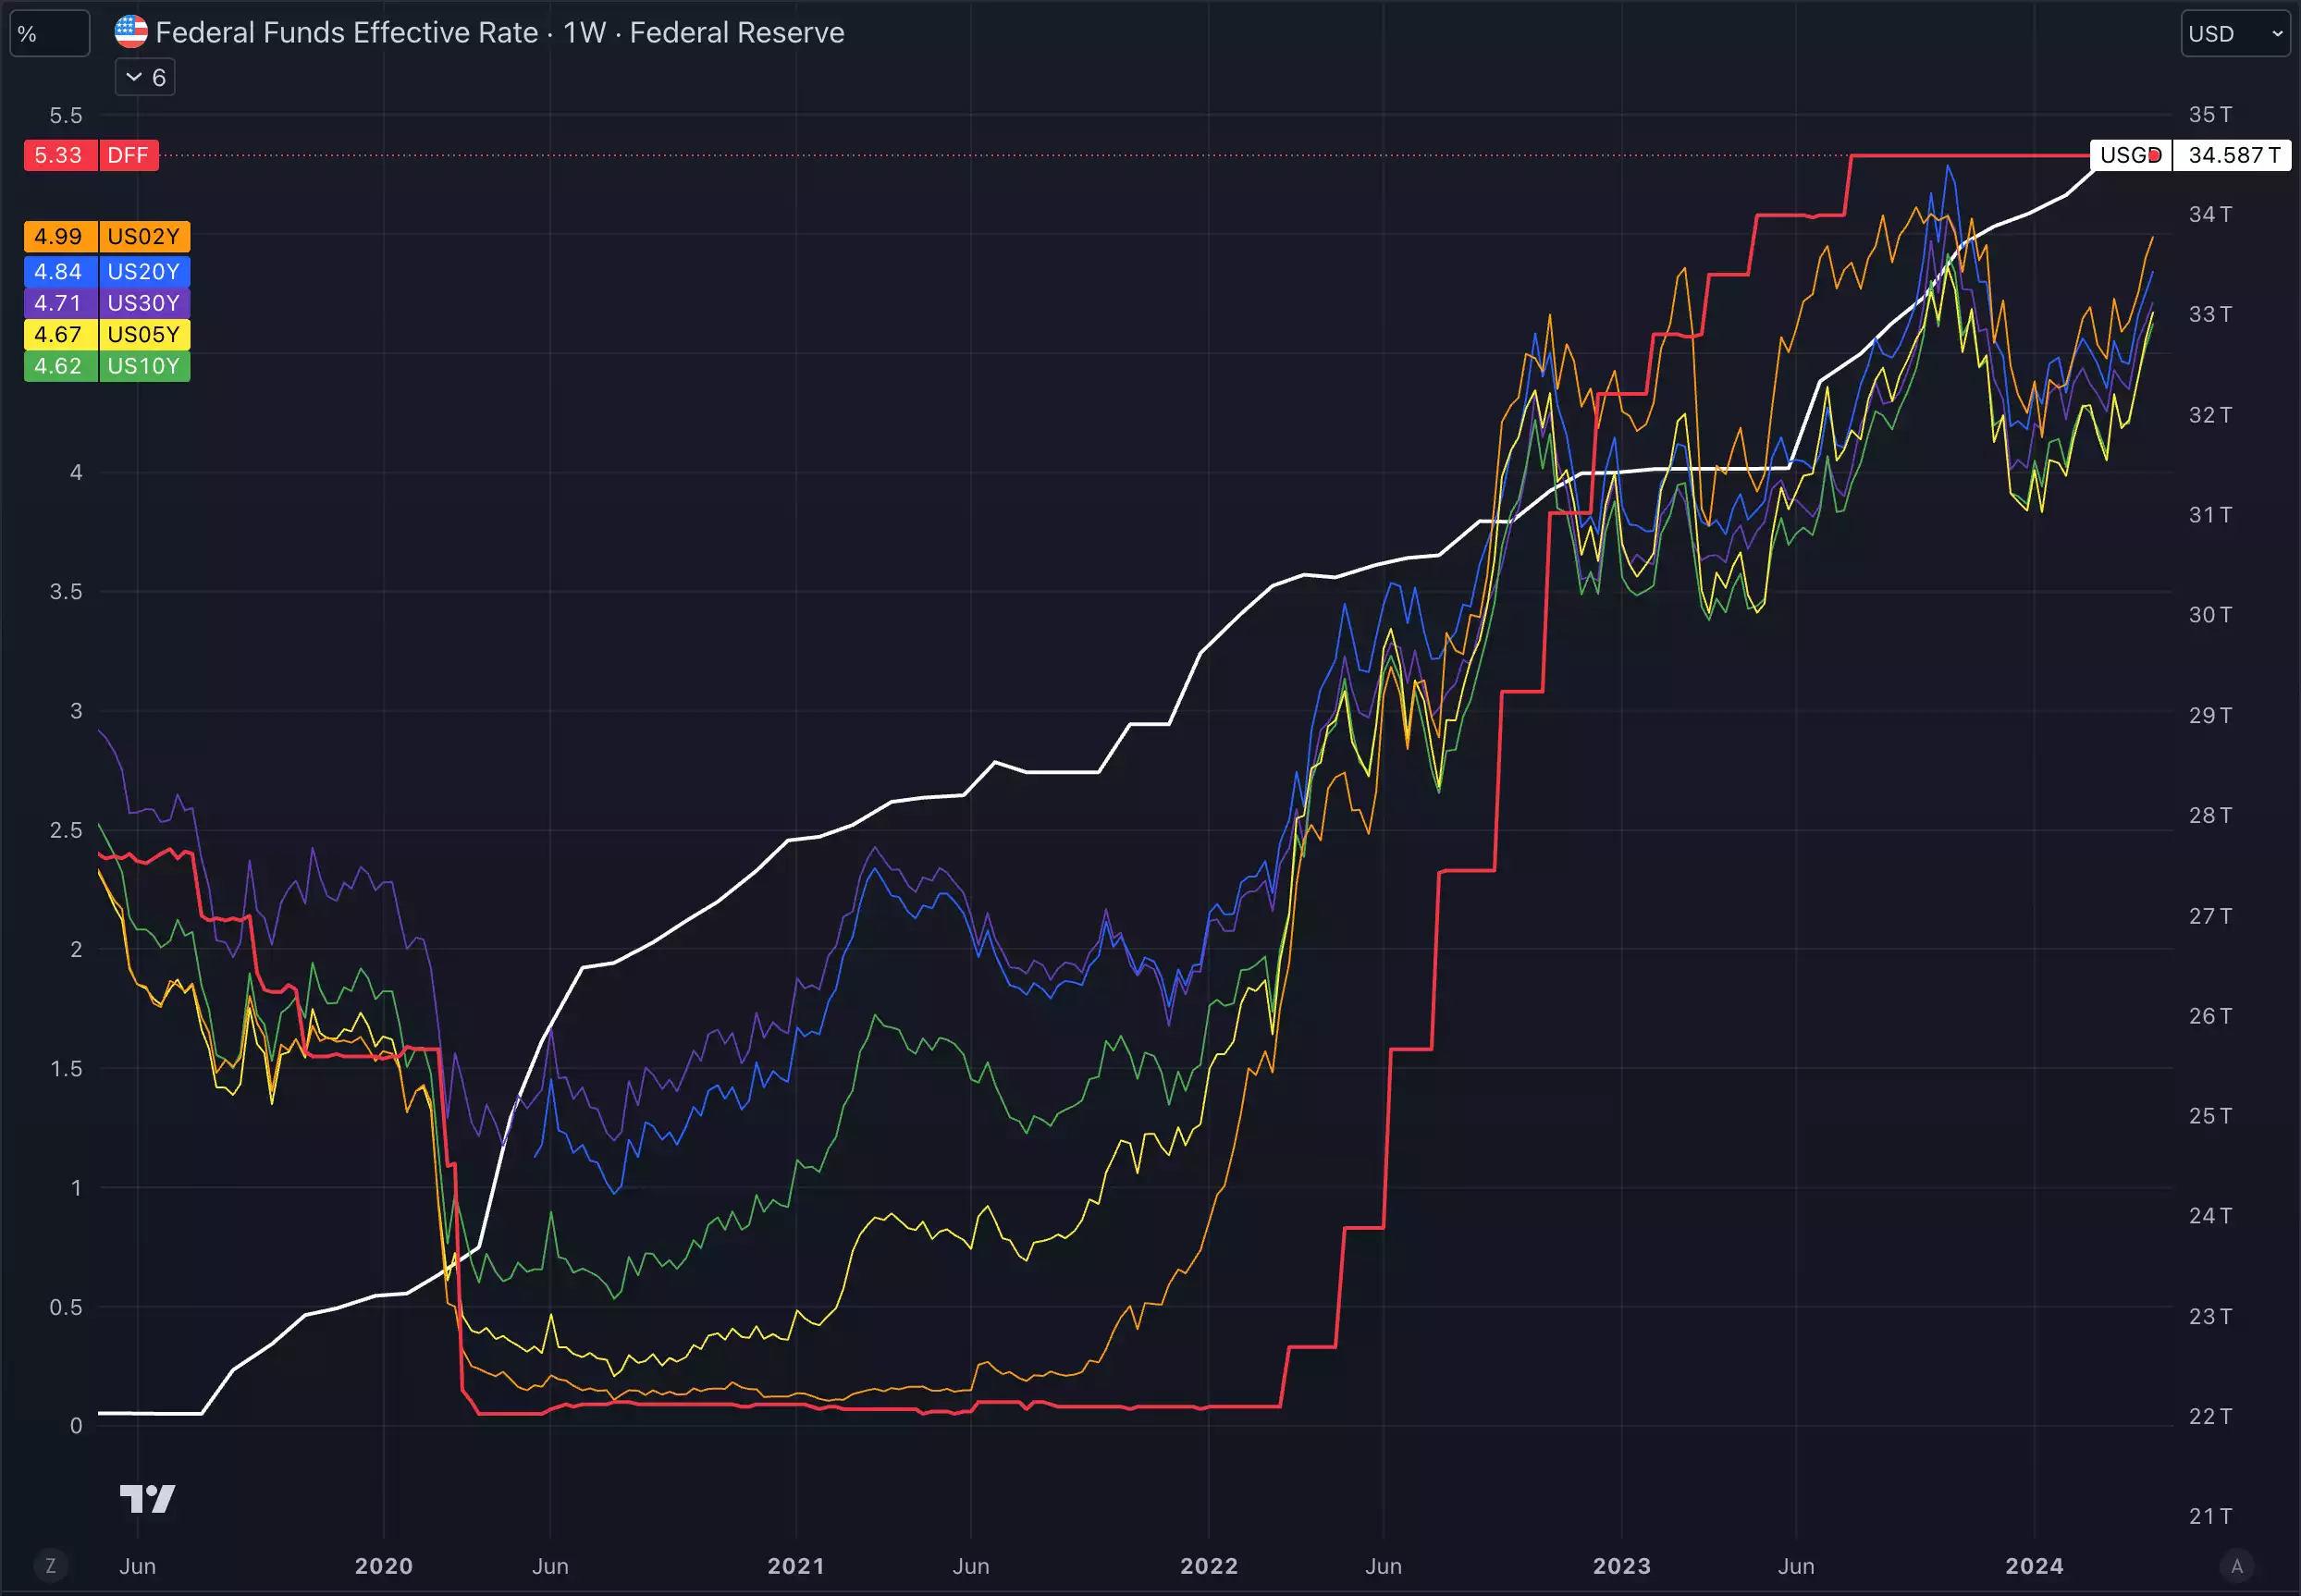
U.S. government debt continues its relentless, and increasingly exponential, march higher with no meaningful attempts to bring it under control and further spending increases over the past month.
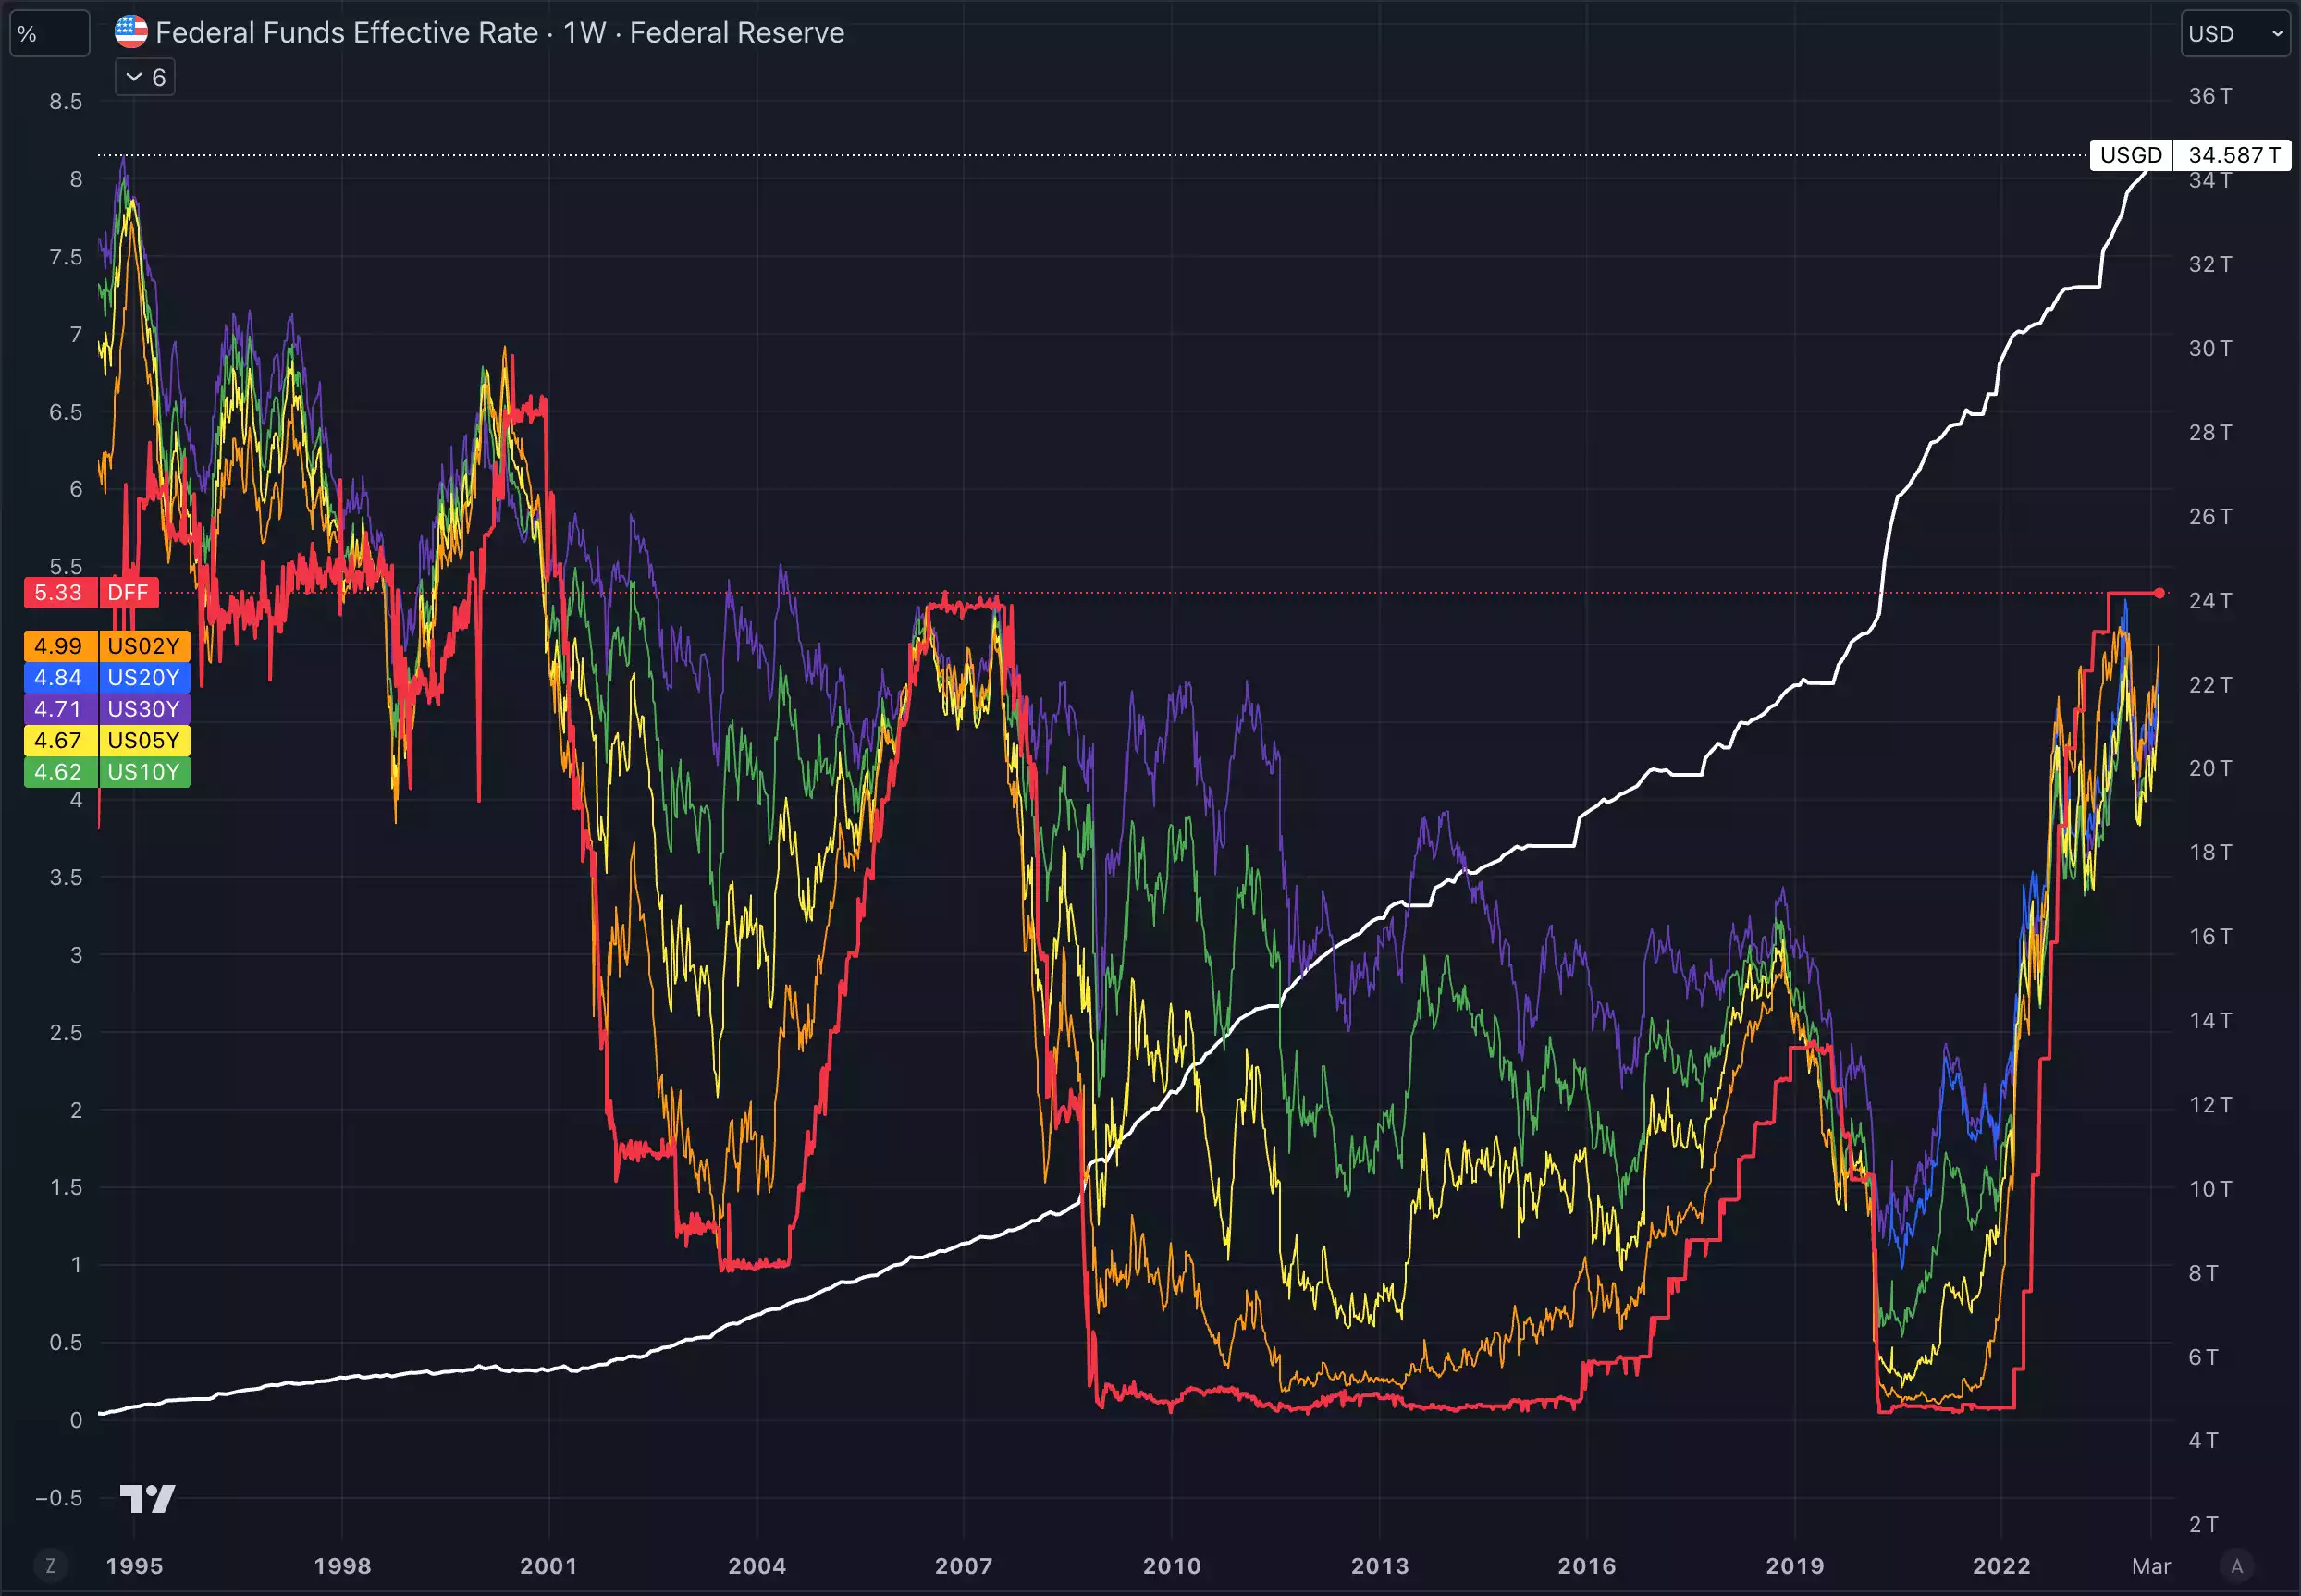
Bond yields have started to experience increased volatility once more as they move higher against a backdrop of government attempts to issue more supply onto a market that is not interested in the increasing levels of risk that supposedly “risk free” assets are starting to represent. We have previously warned that breaking to new highs in yields will be the thing to watch as a major warning sign that we are heading into a situation where the Fed will be forced to respond, and we appear to be approaching that point rapidly.
Where are we currently in the Global Liquidity Cycle?
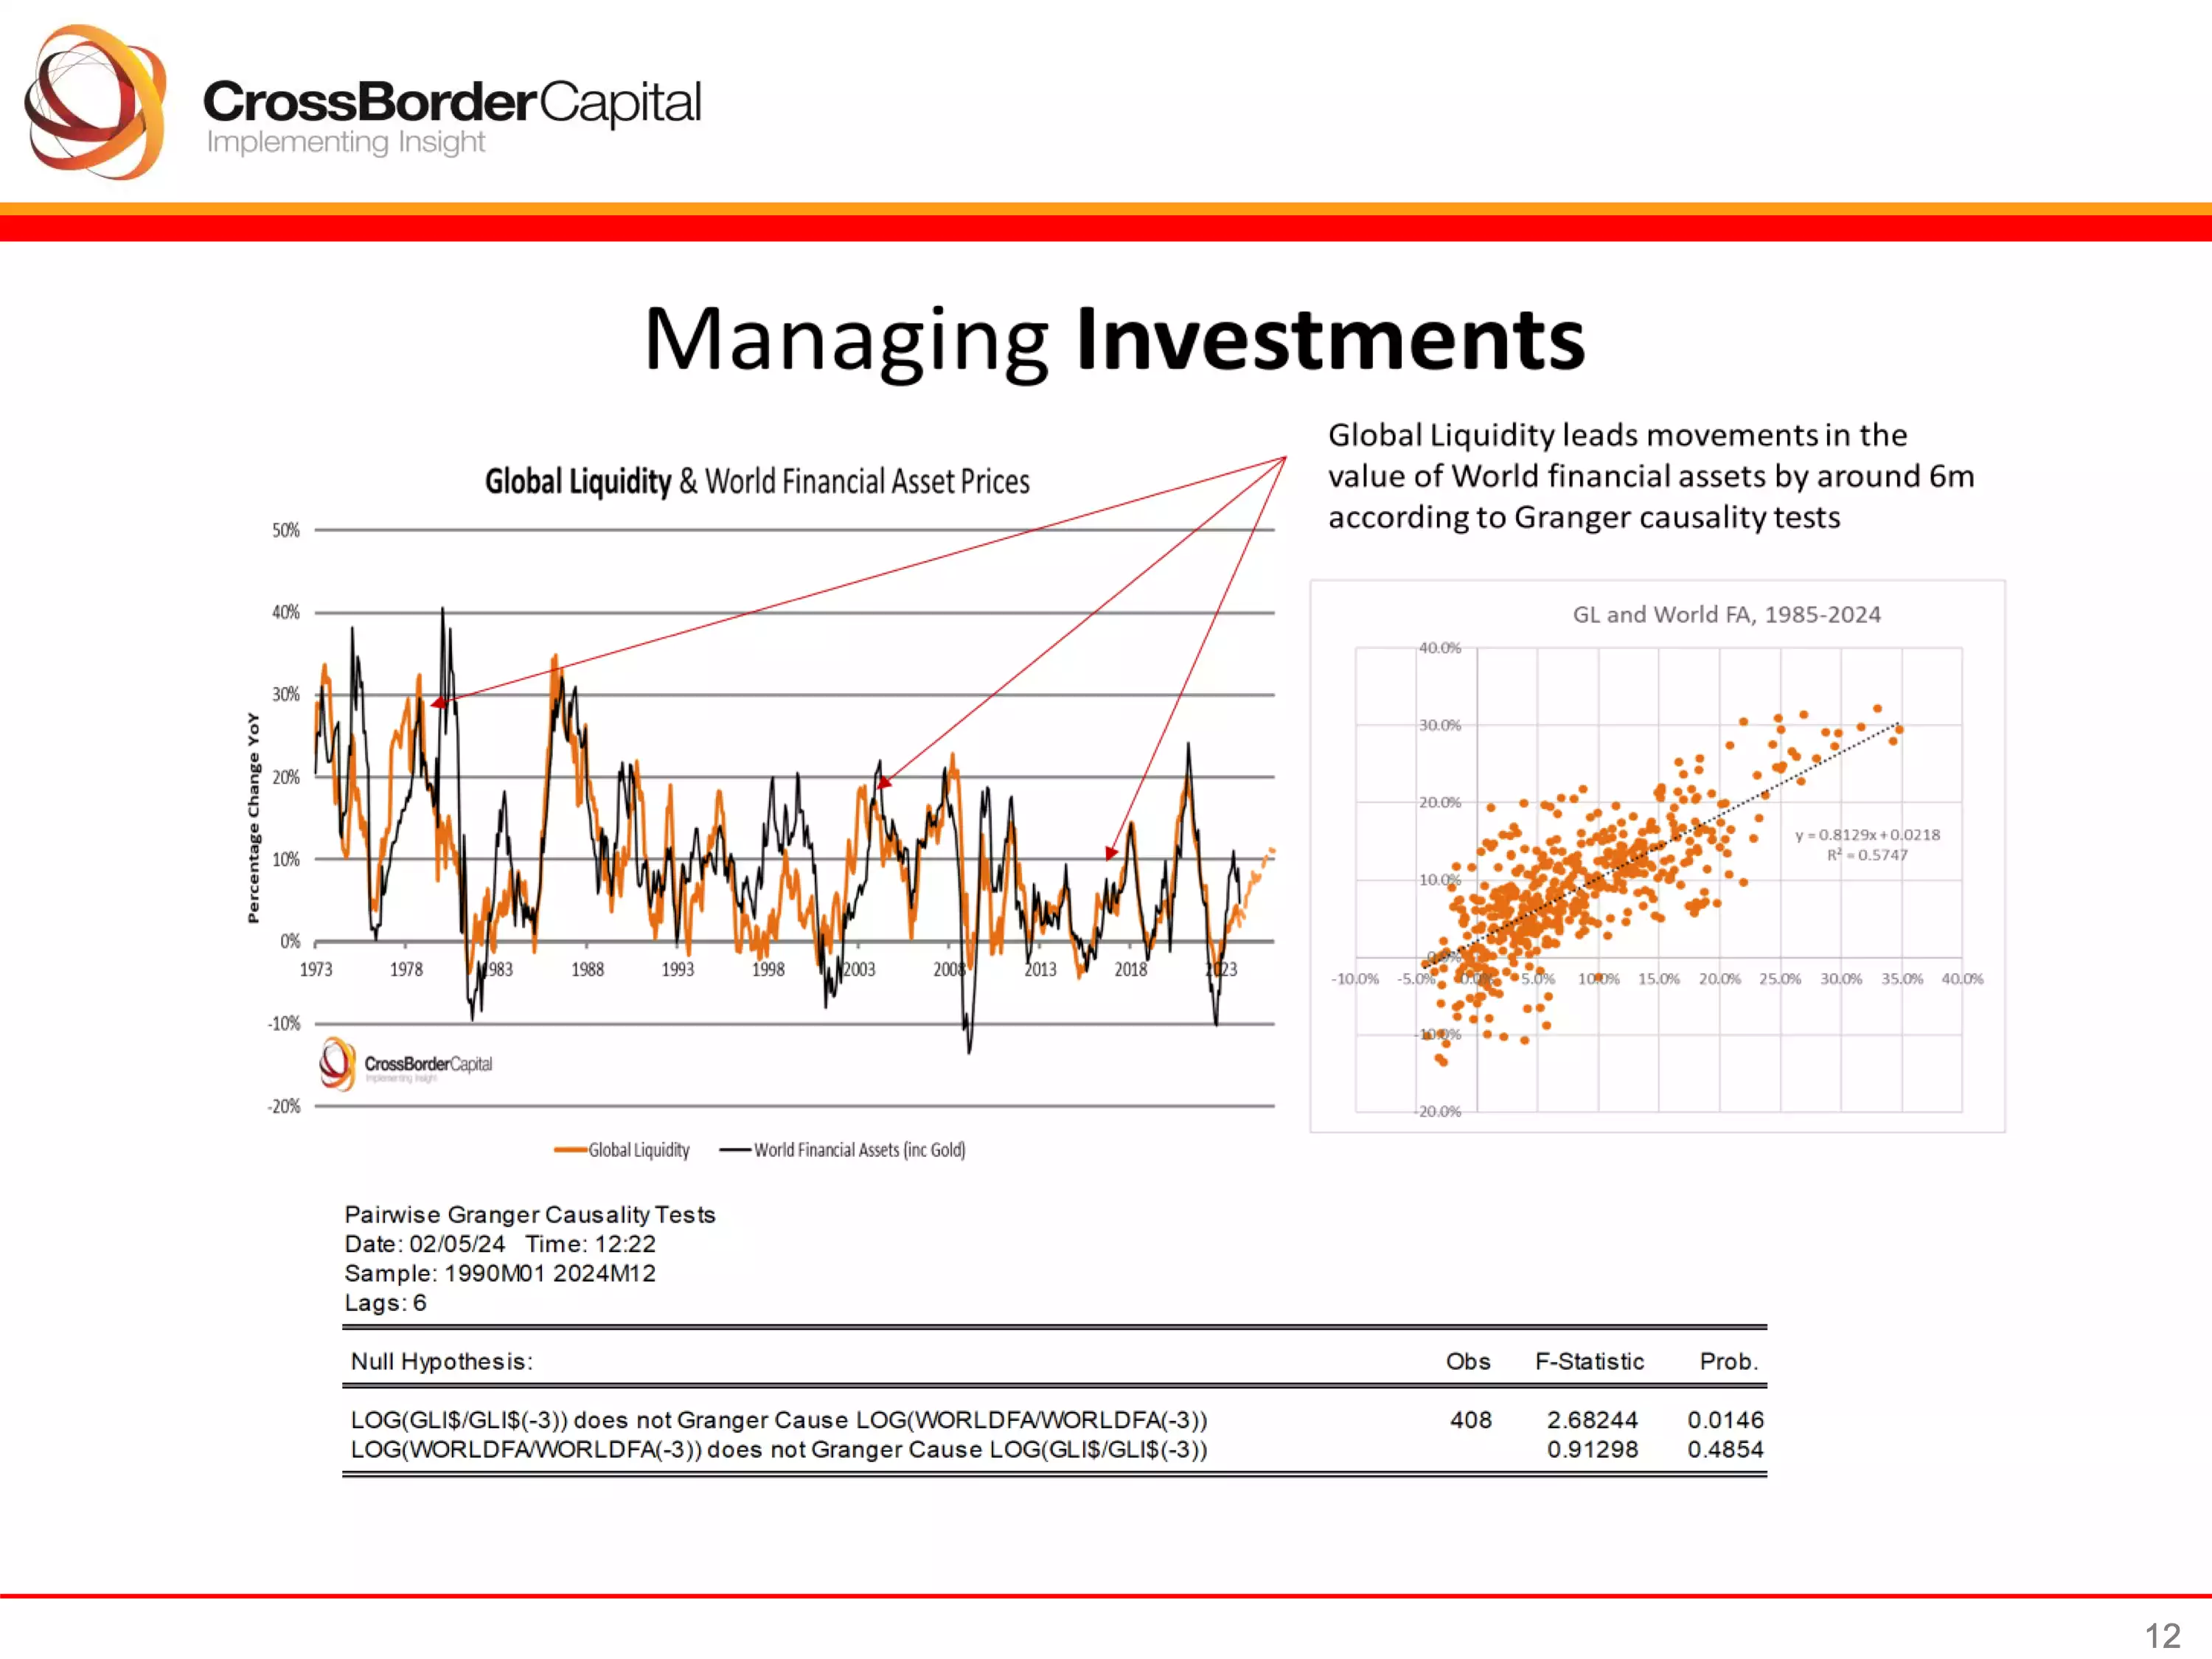
Global Liquidity leads the movement of World financial assets, so this is the indicator we look most closely at to determine where the opportunities are to take advantage of.
Global Liquidity is currently recovering from the cycle lows but is experiencing a pull-back in the latest readings. The path upwards will not be a straight line, but we know the likely destination.
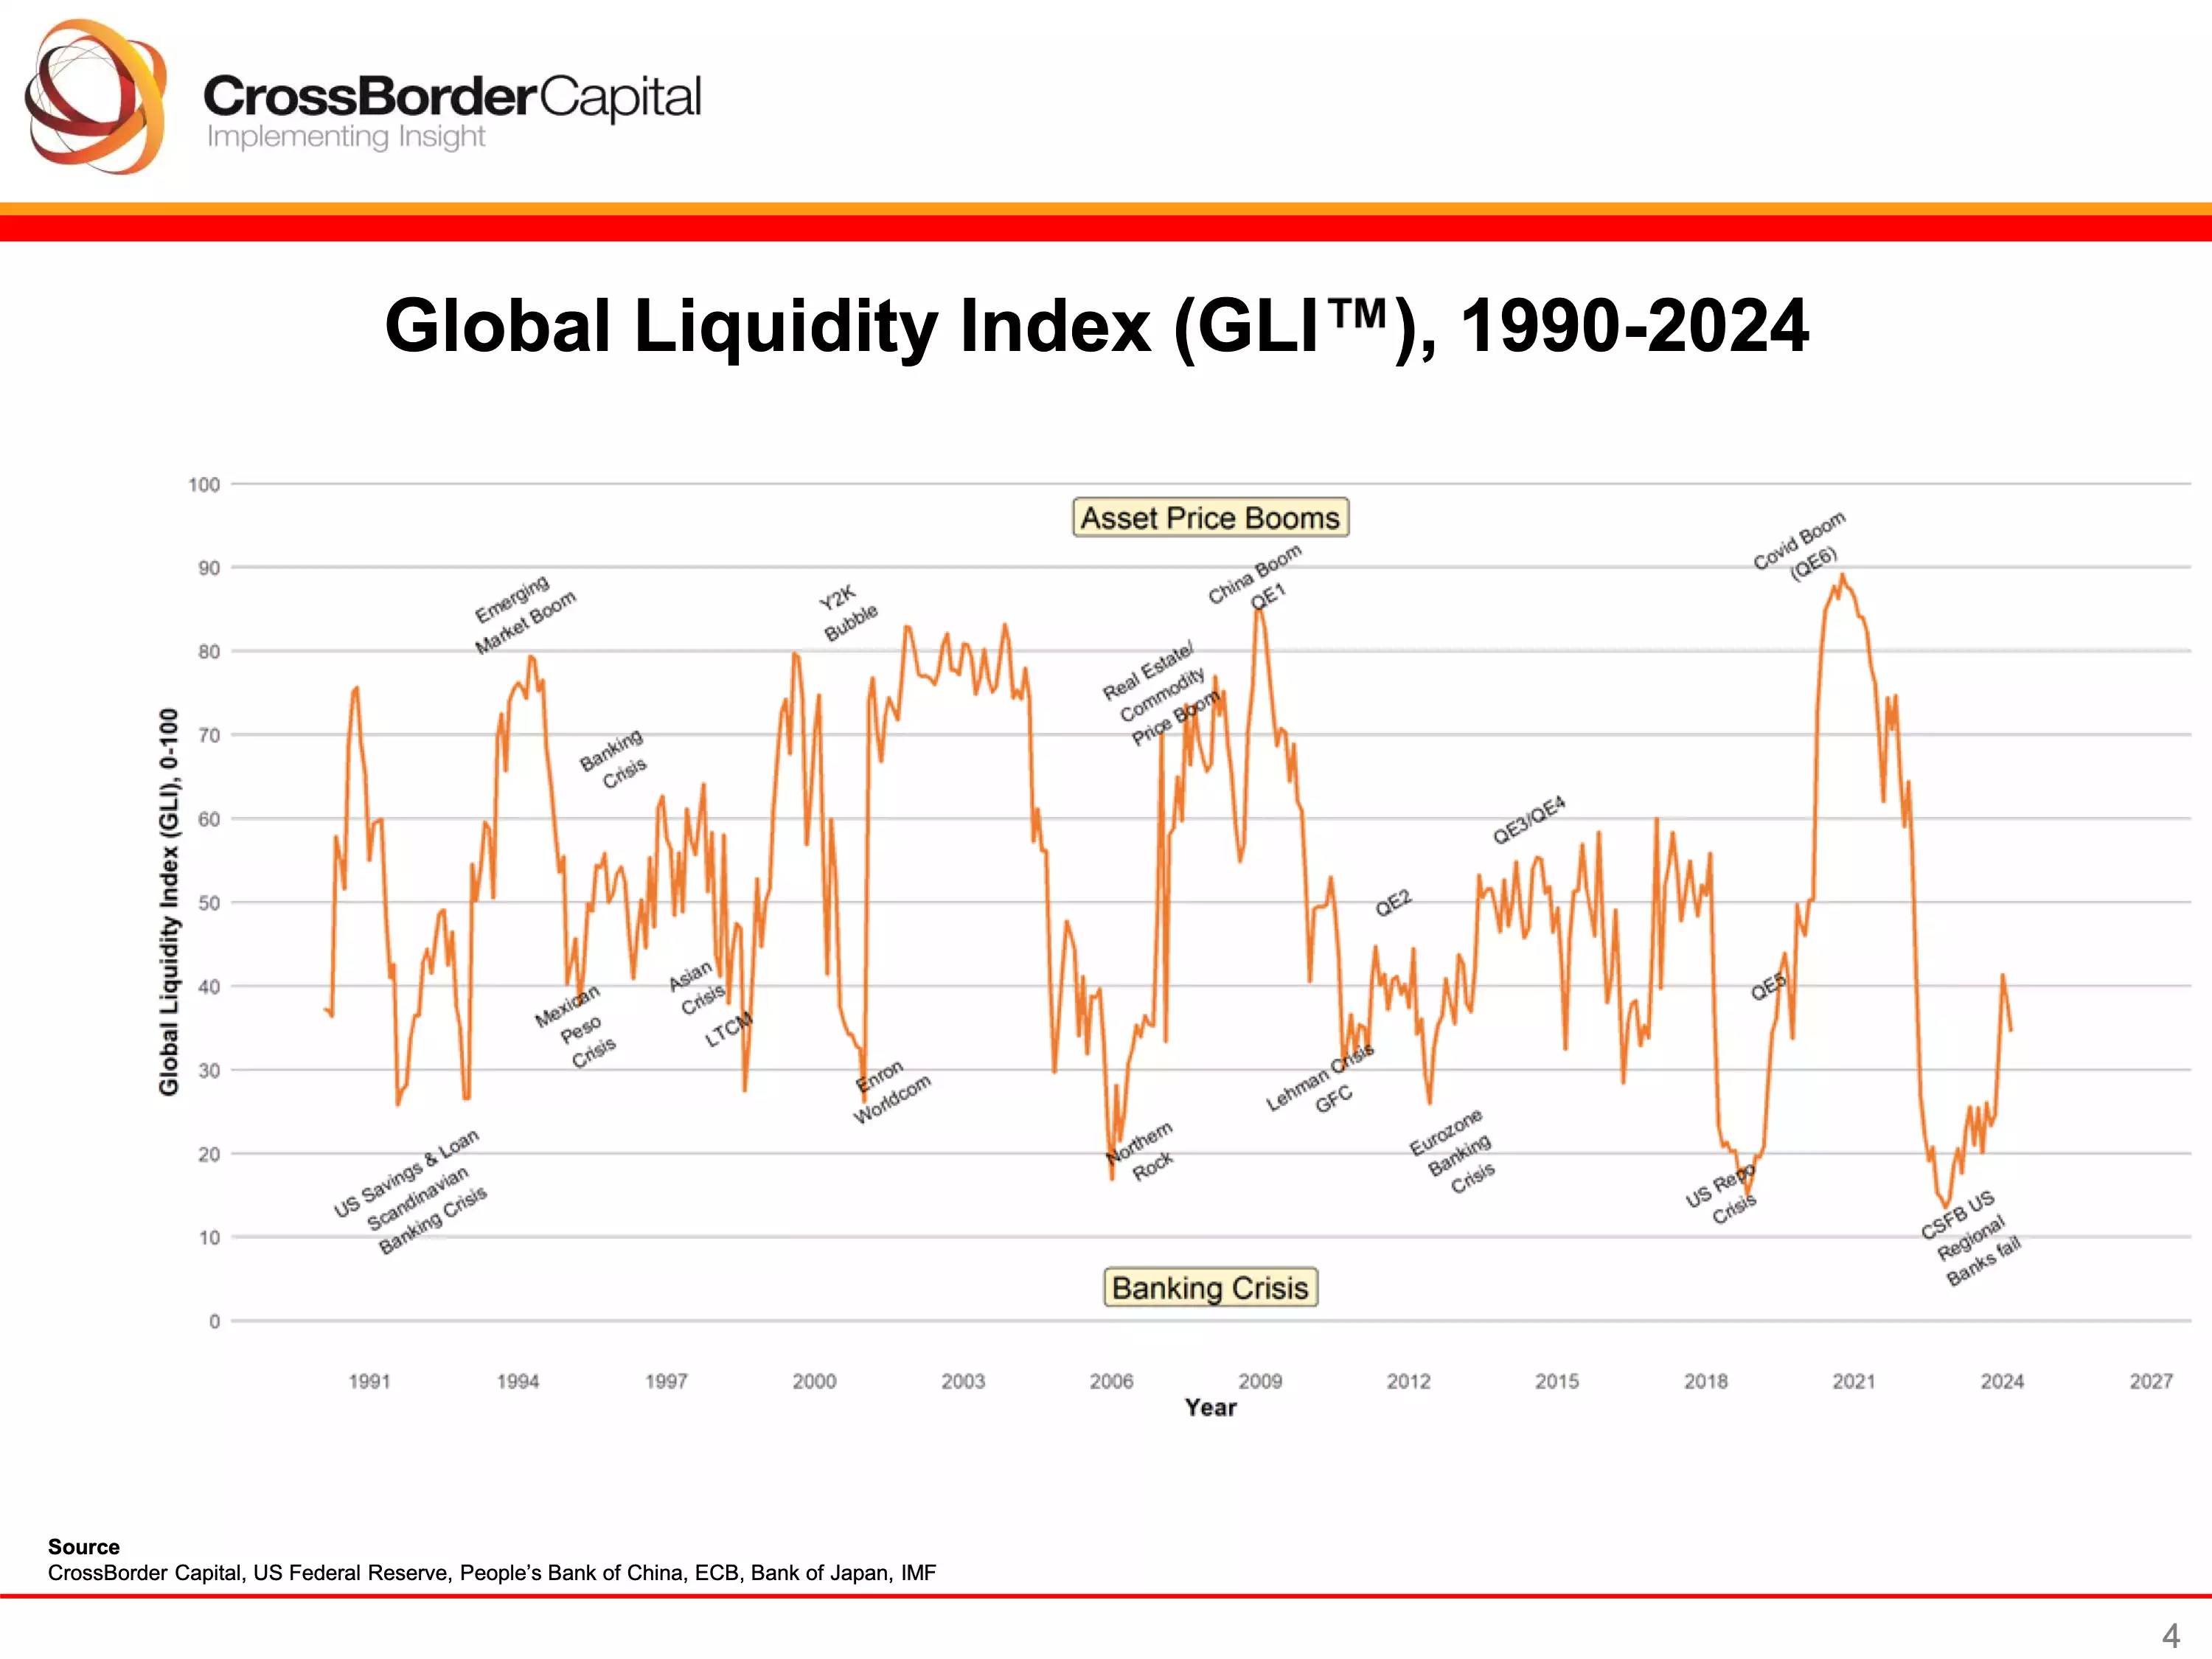
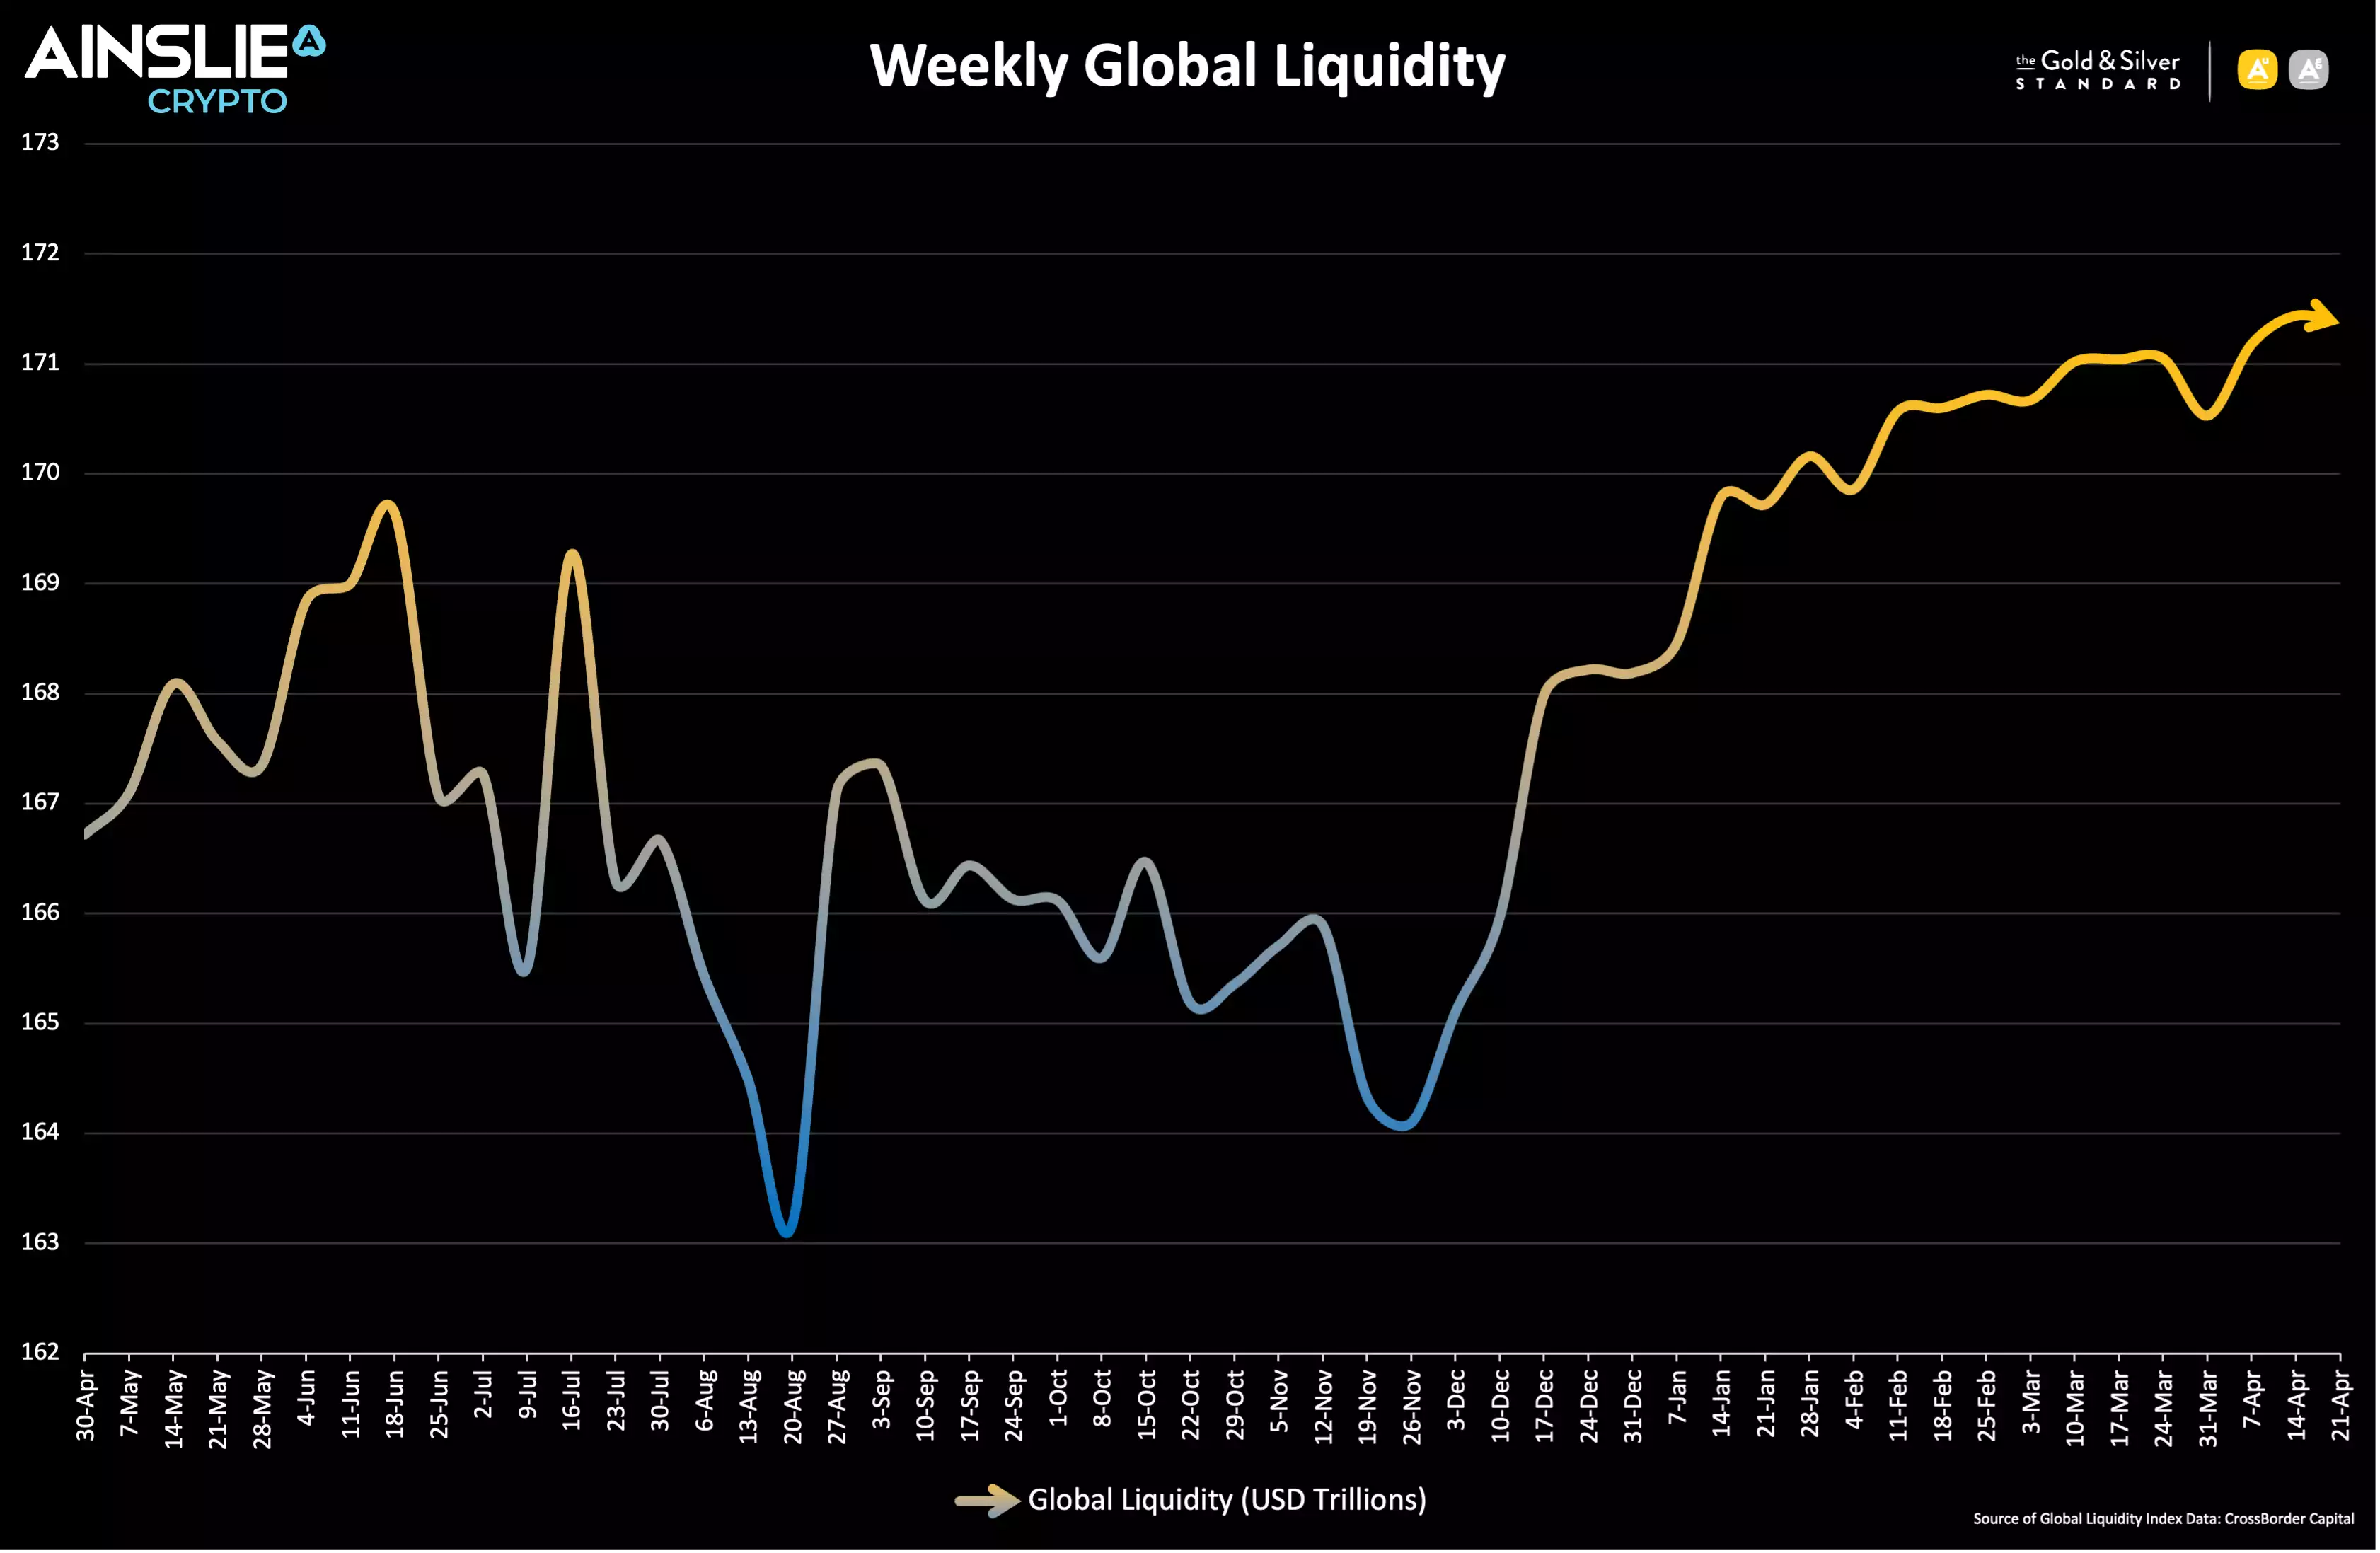
Looking at a weekly level, Global Liquidity continues to hover around the US$171 trillion level, despite the short-term weakness in the broader index.
Macro Assets for Macro Cycles
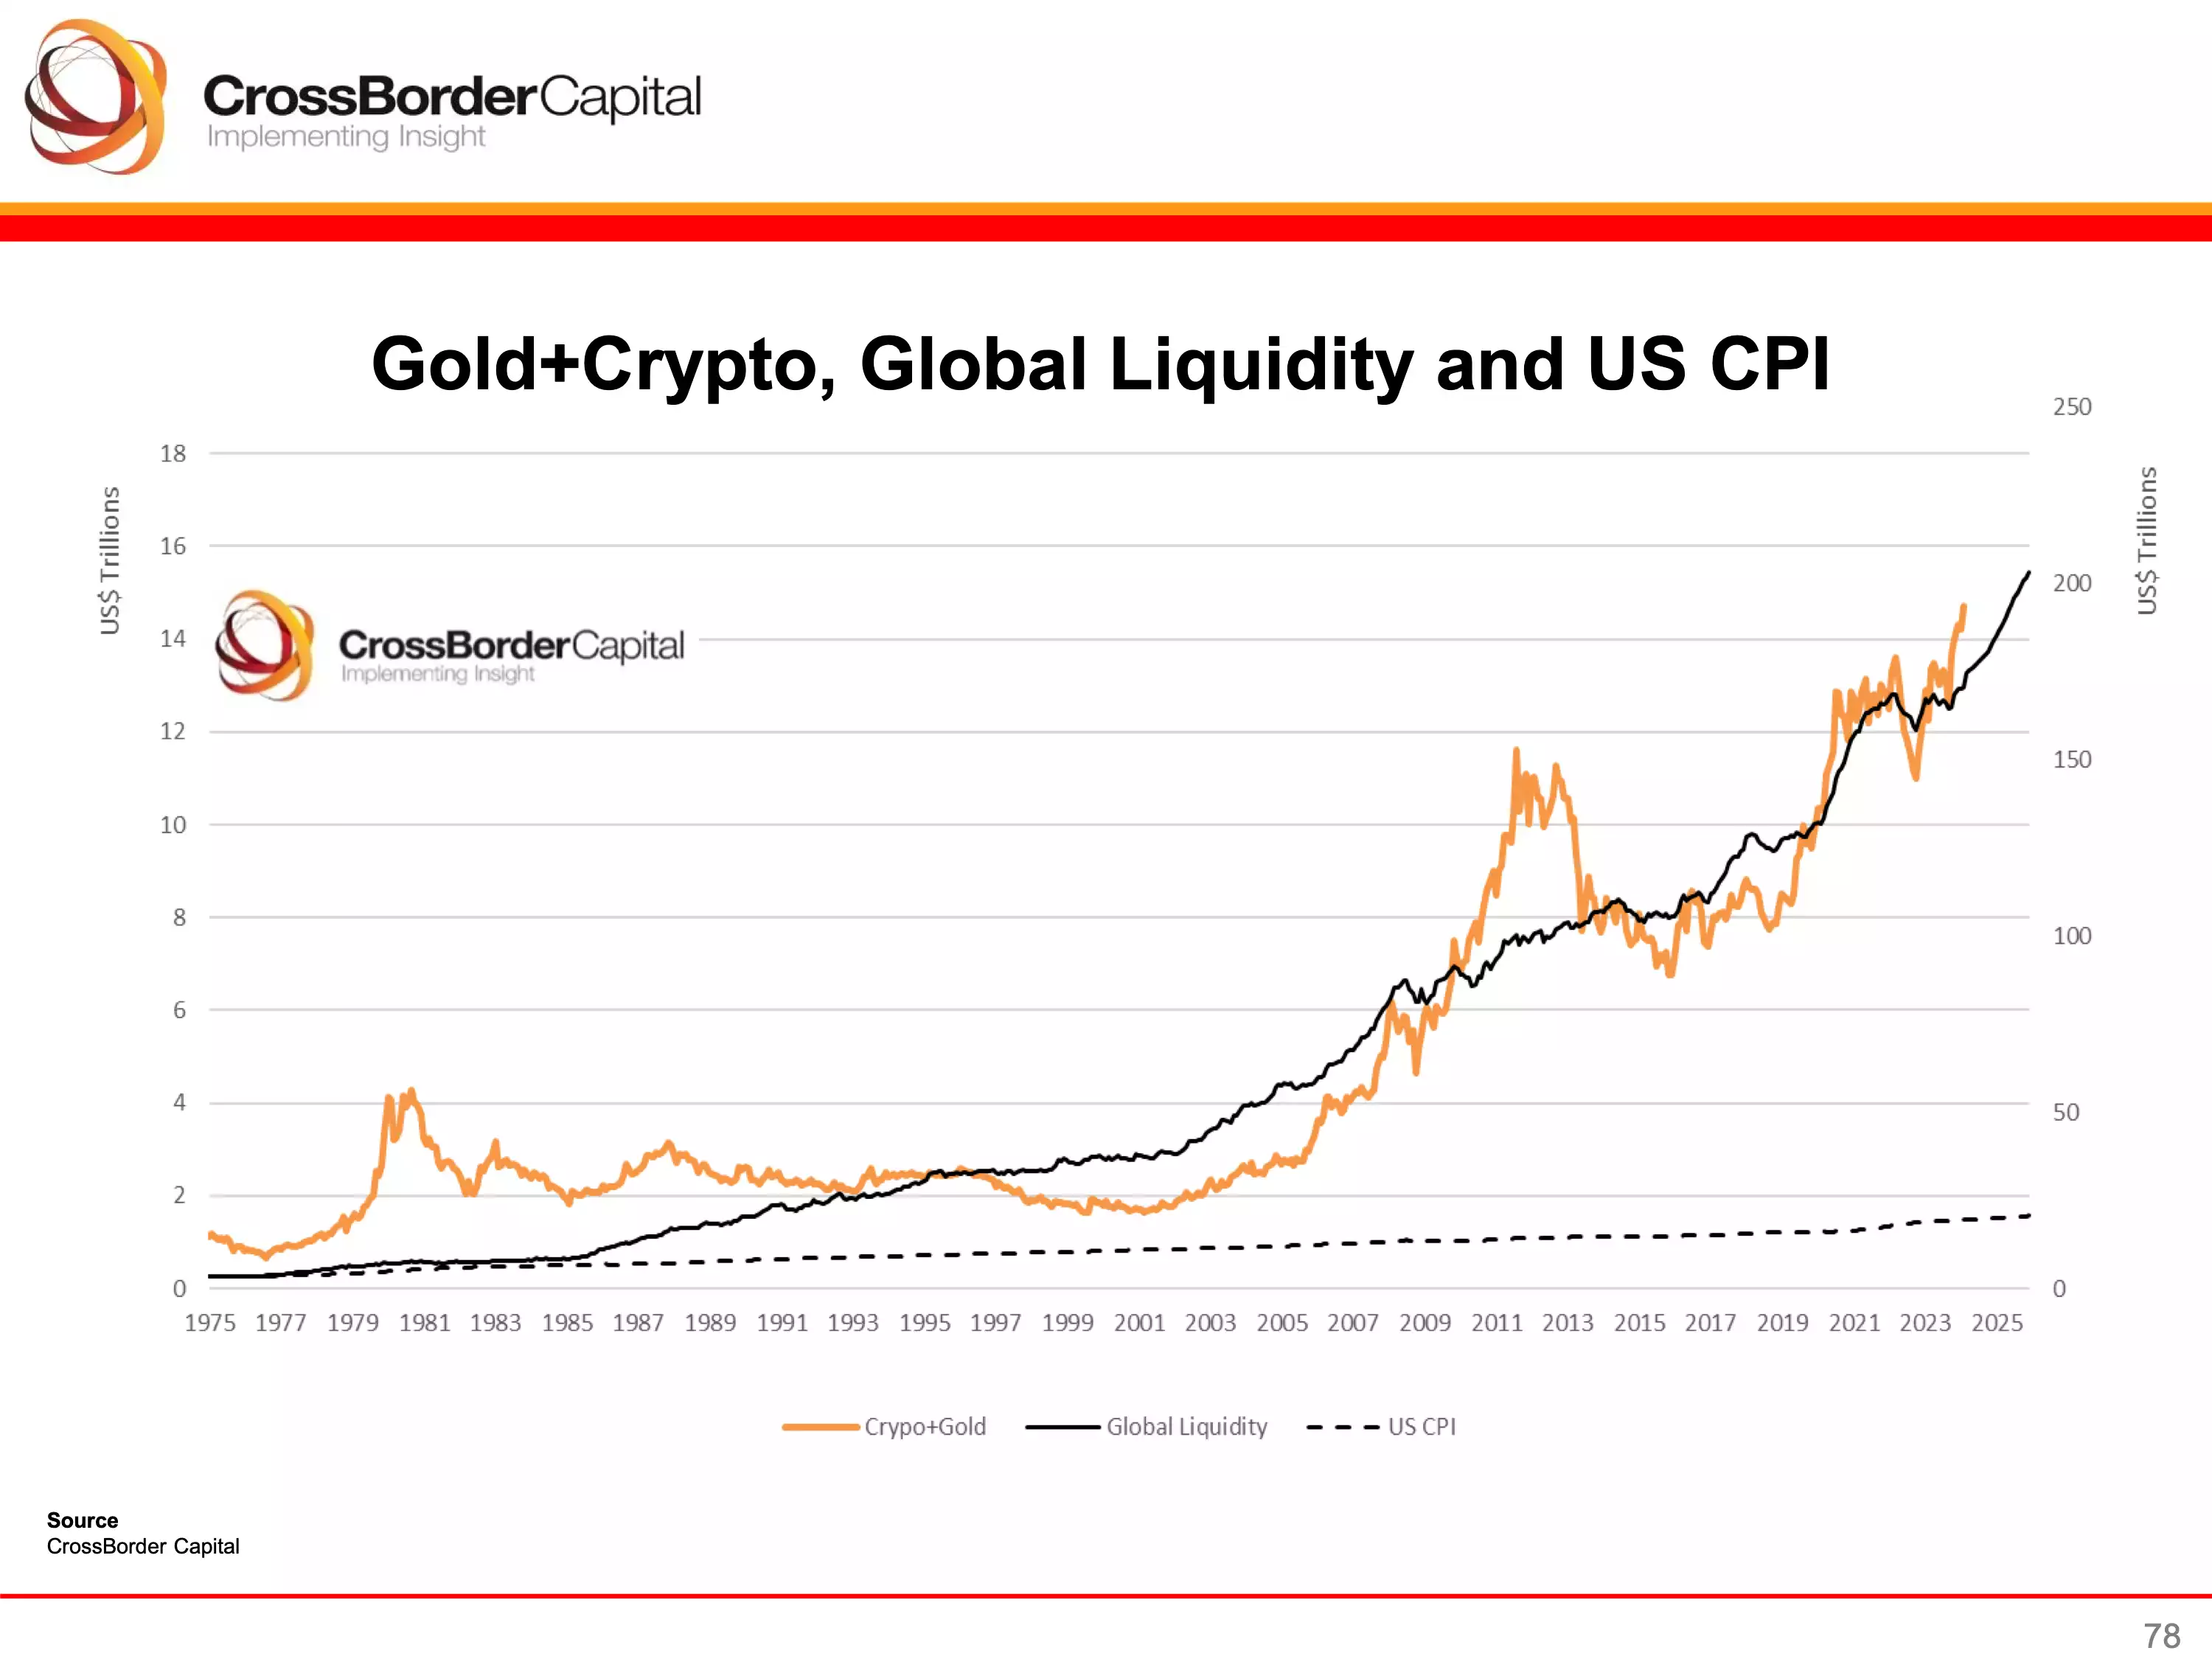
Understanding Consumer Price Inflation (CPI) is far less important than Asset Price Inflation in ensuring wealth isn’t eroded, and can actually grow, over the long term. A combination of Gold, Silver, and Bitcoin keep up with the growth in Global Liquidity over time, and the corresponding debasement of fiat currencies. As such we look to trade into each at the appropriate times to take optimum advantage of the cycles. When correctly timing and structuring the rotation, it is possible to significantly outperform ongoing monetary debasement.
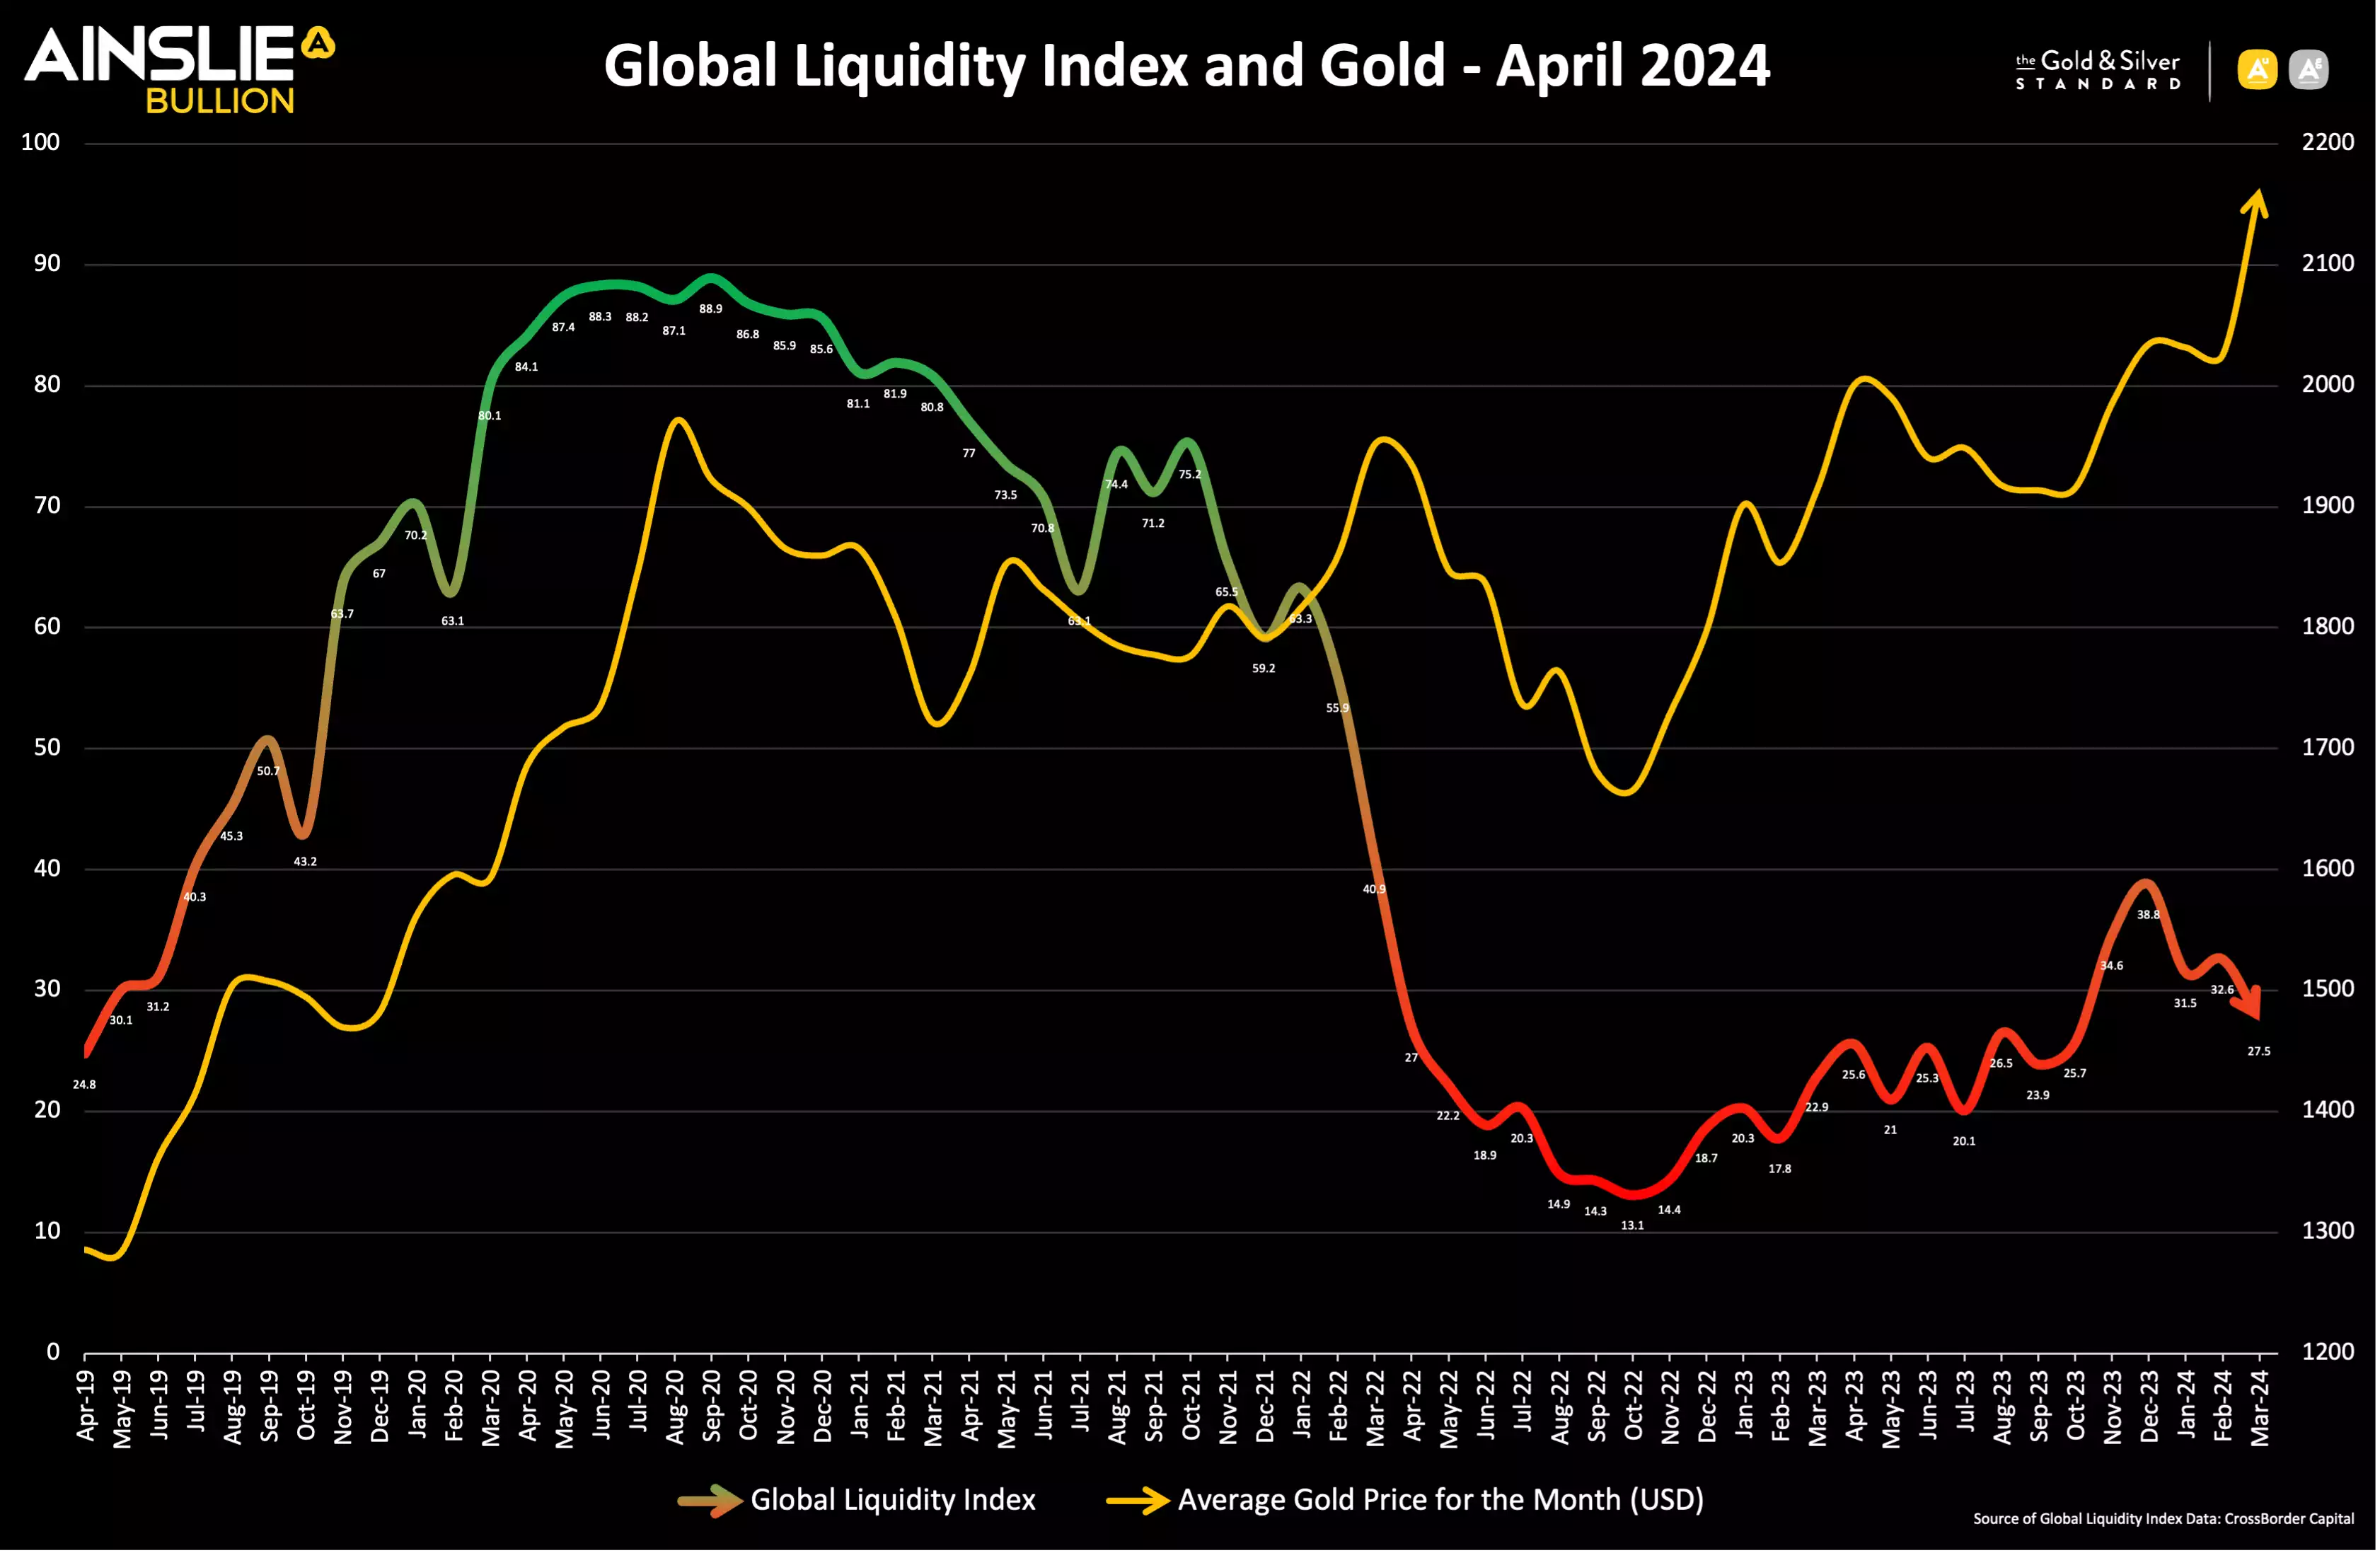
The Gold cycle low was in September 2022 and the price appears to be rising consistently with an improving Global Liquidity picture ever since. The recent continued strength and new all-time highs against a cooling short term Global Liquidity backdrop is especially bullish and has pushed even higher on the back of the recent geopolitical uncertainty.
It is a similar story with Silver which also had a cycle low in September 2022 and is holding on nicely to recent gains.
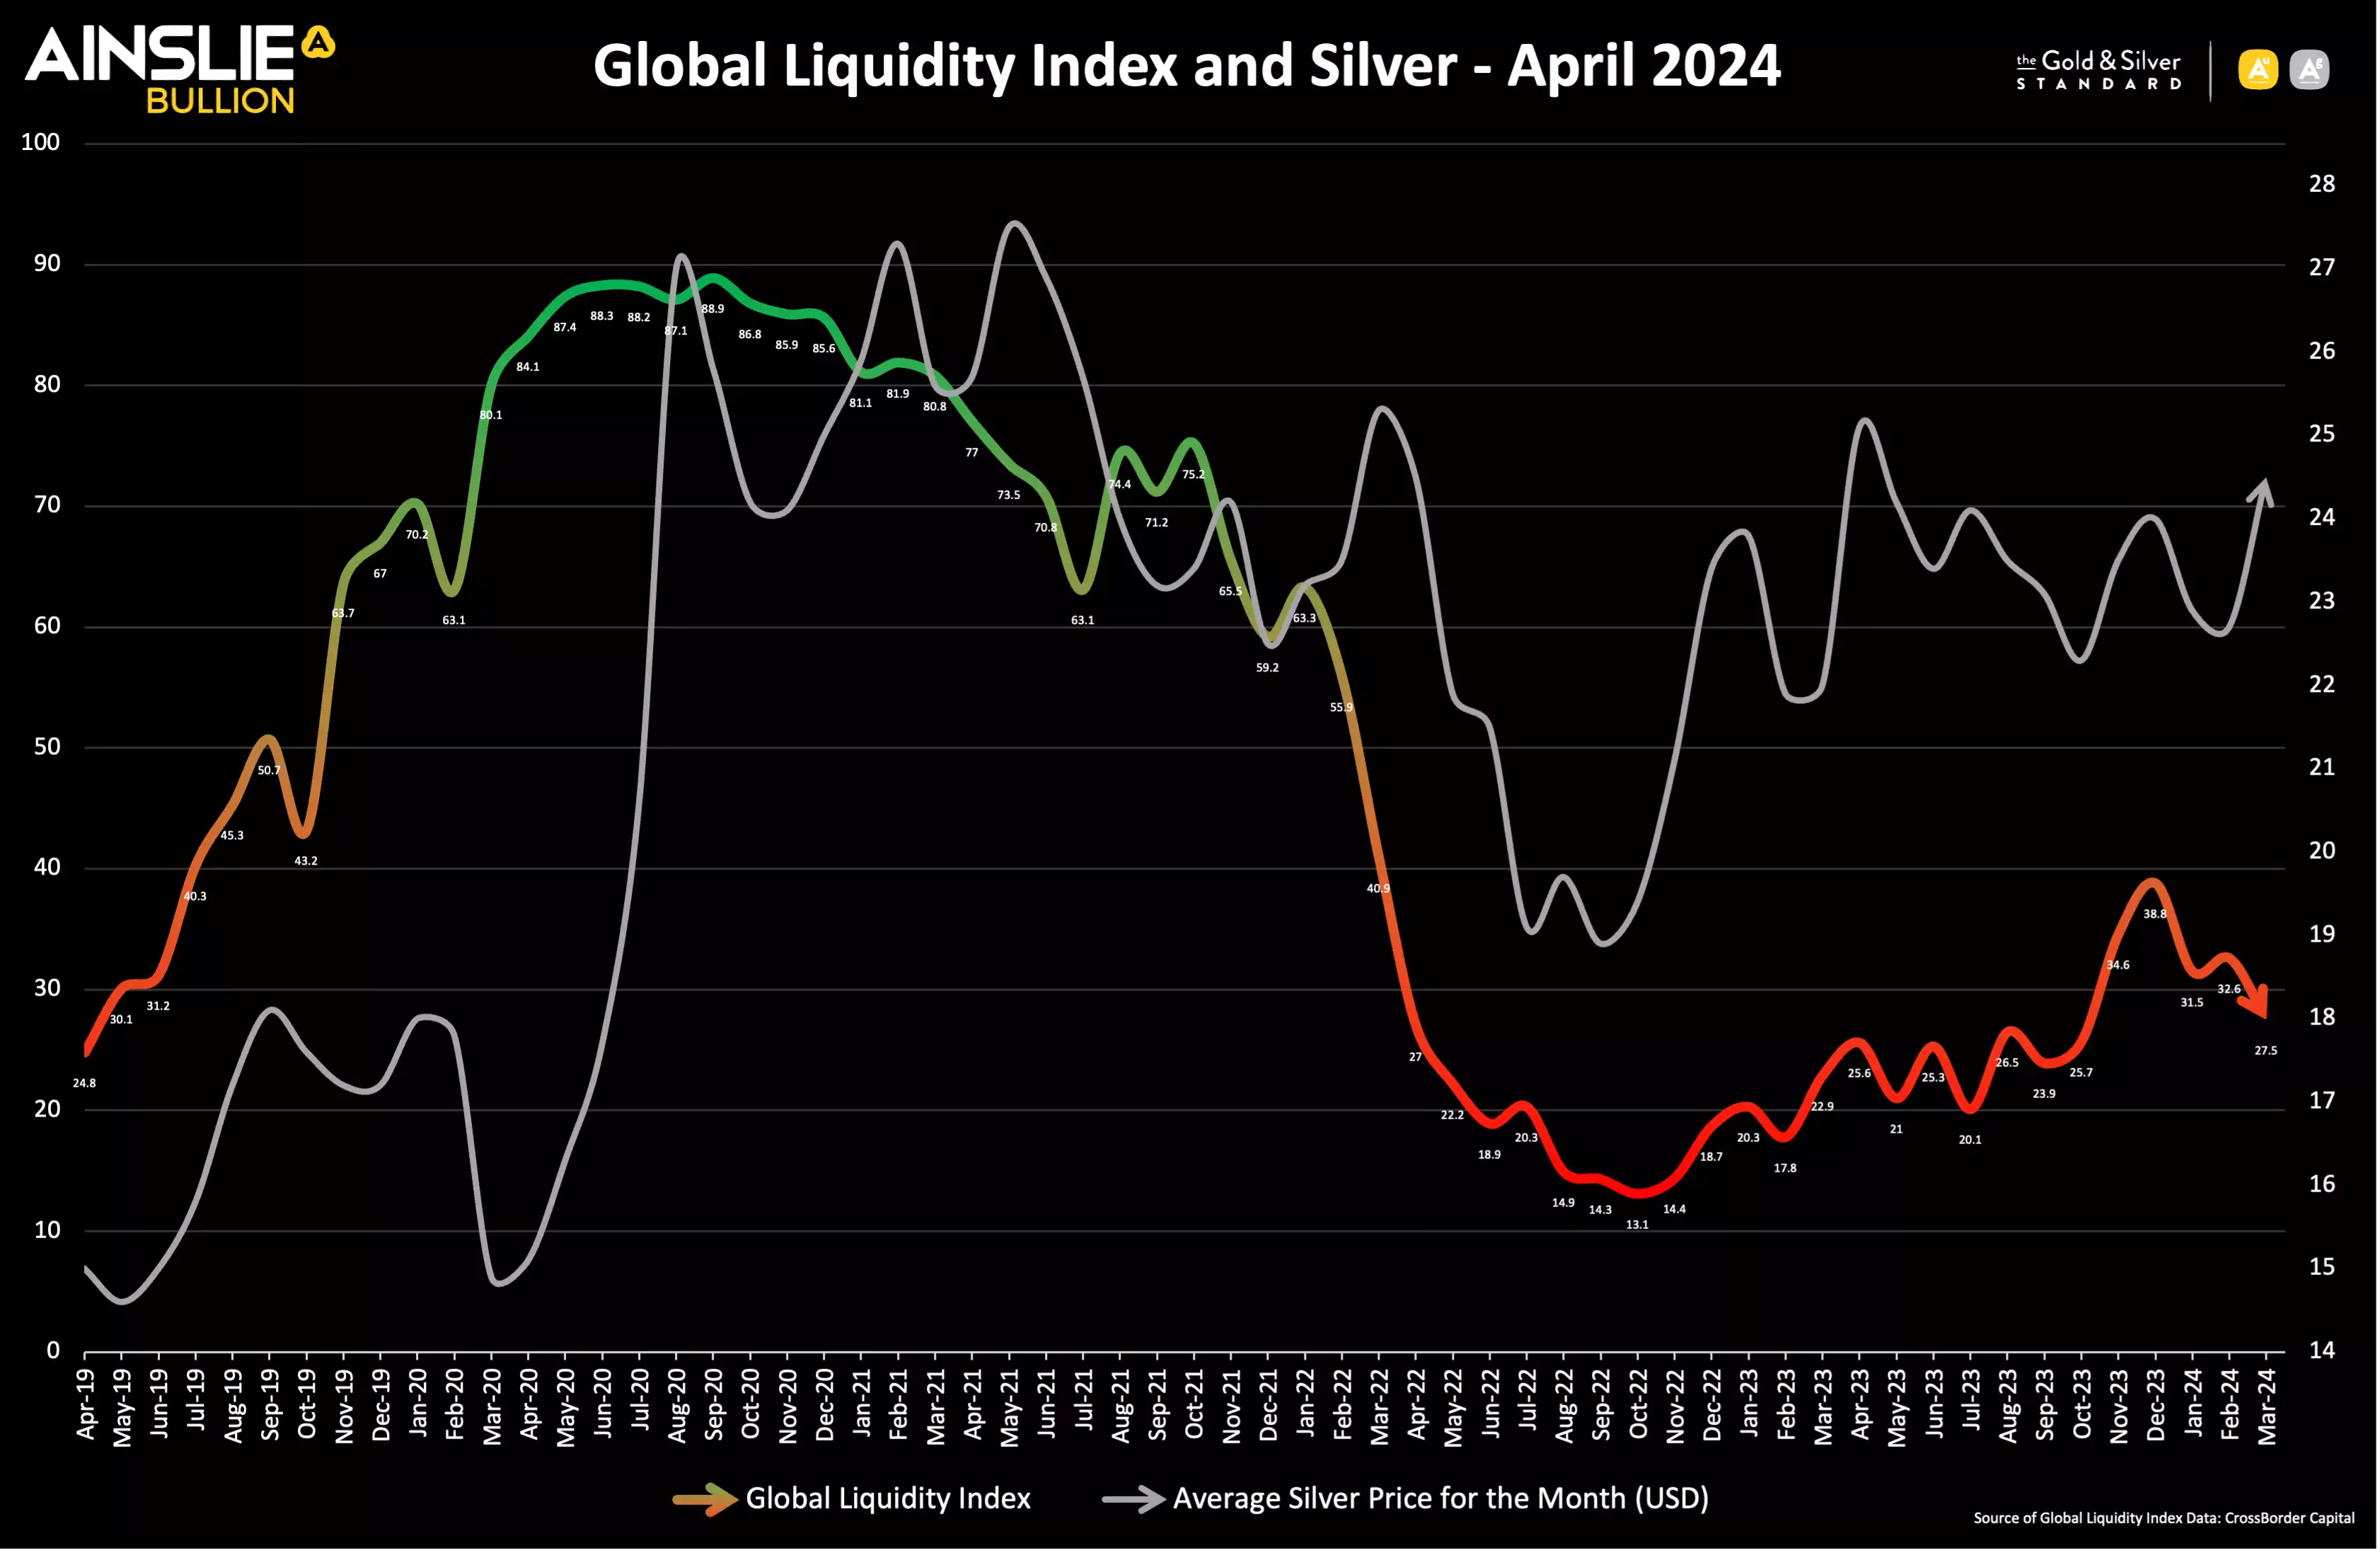
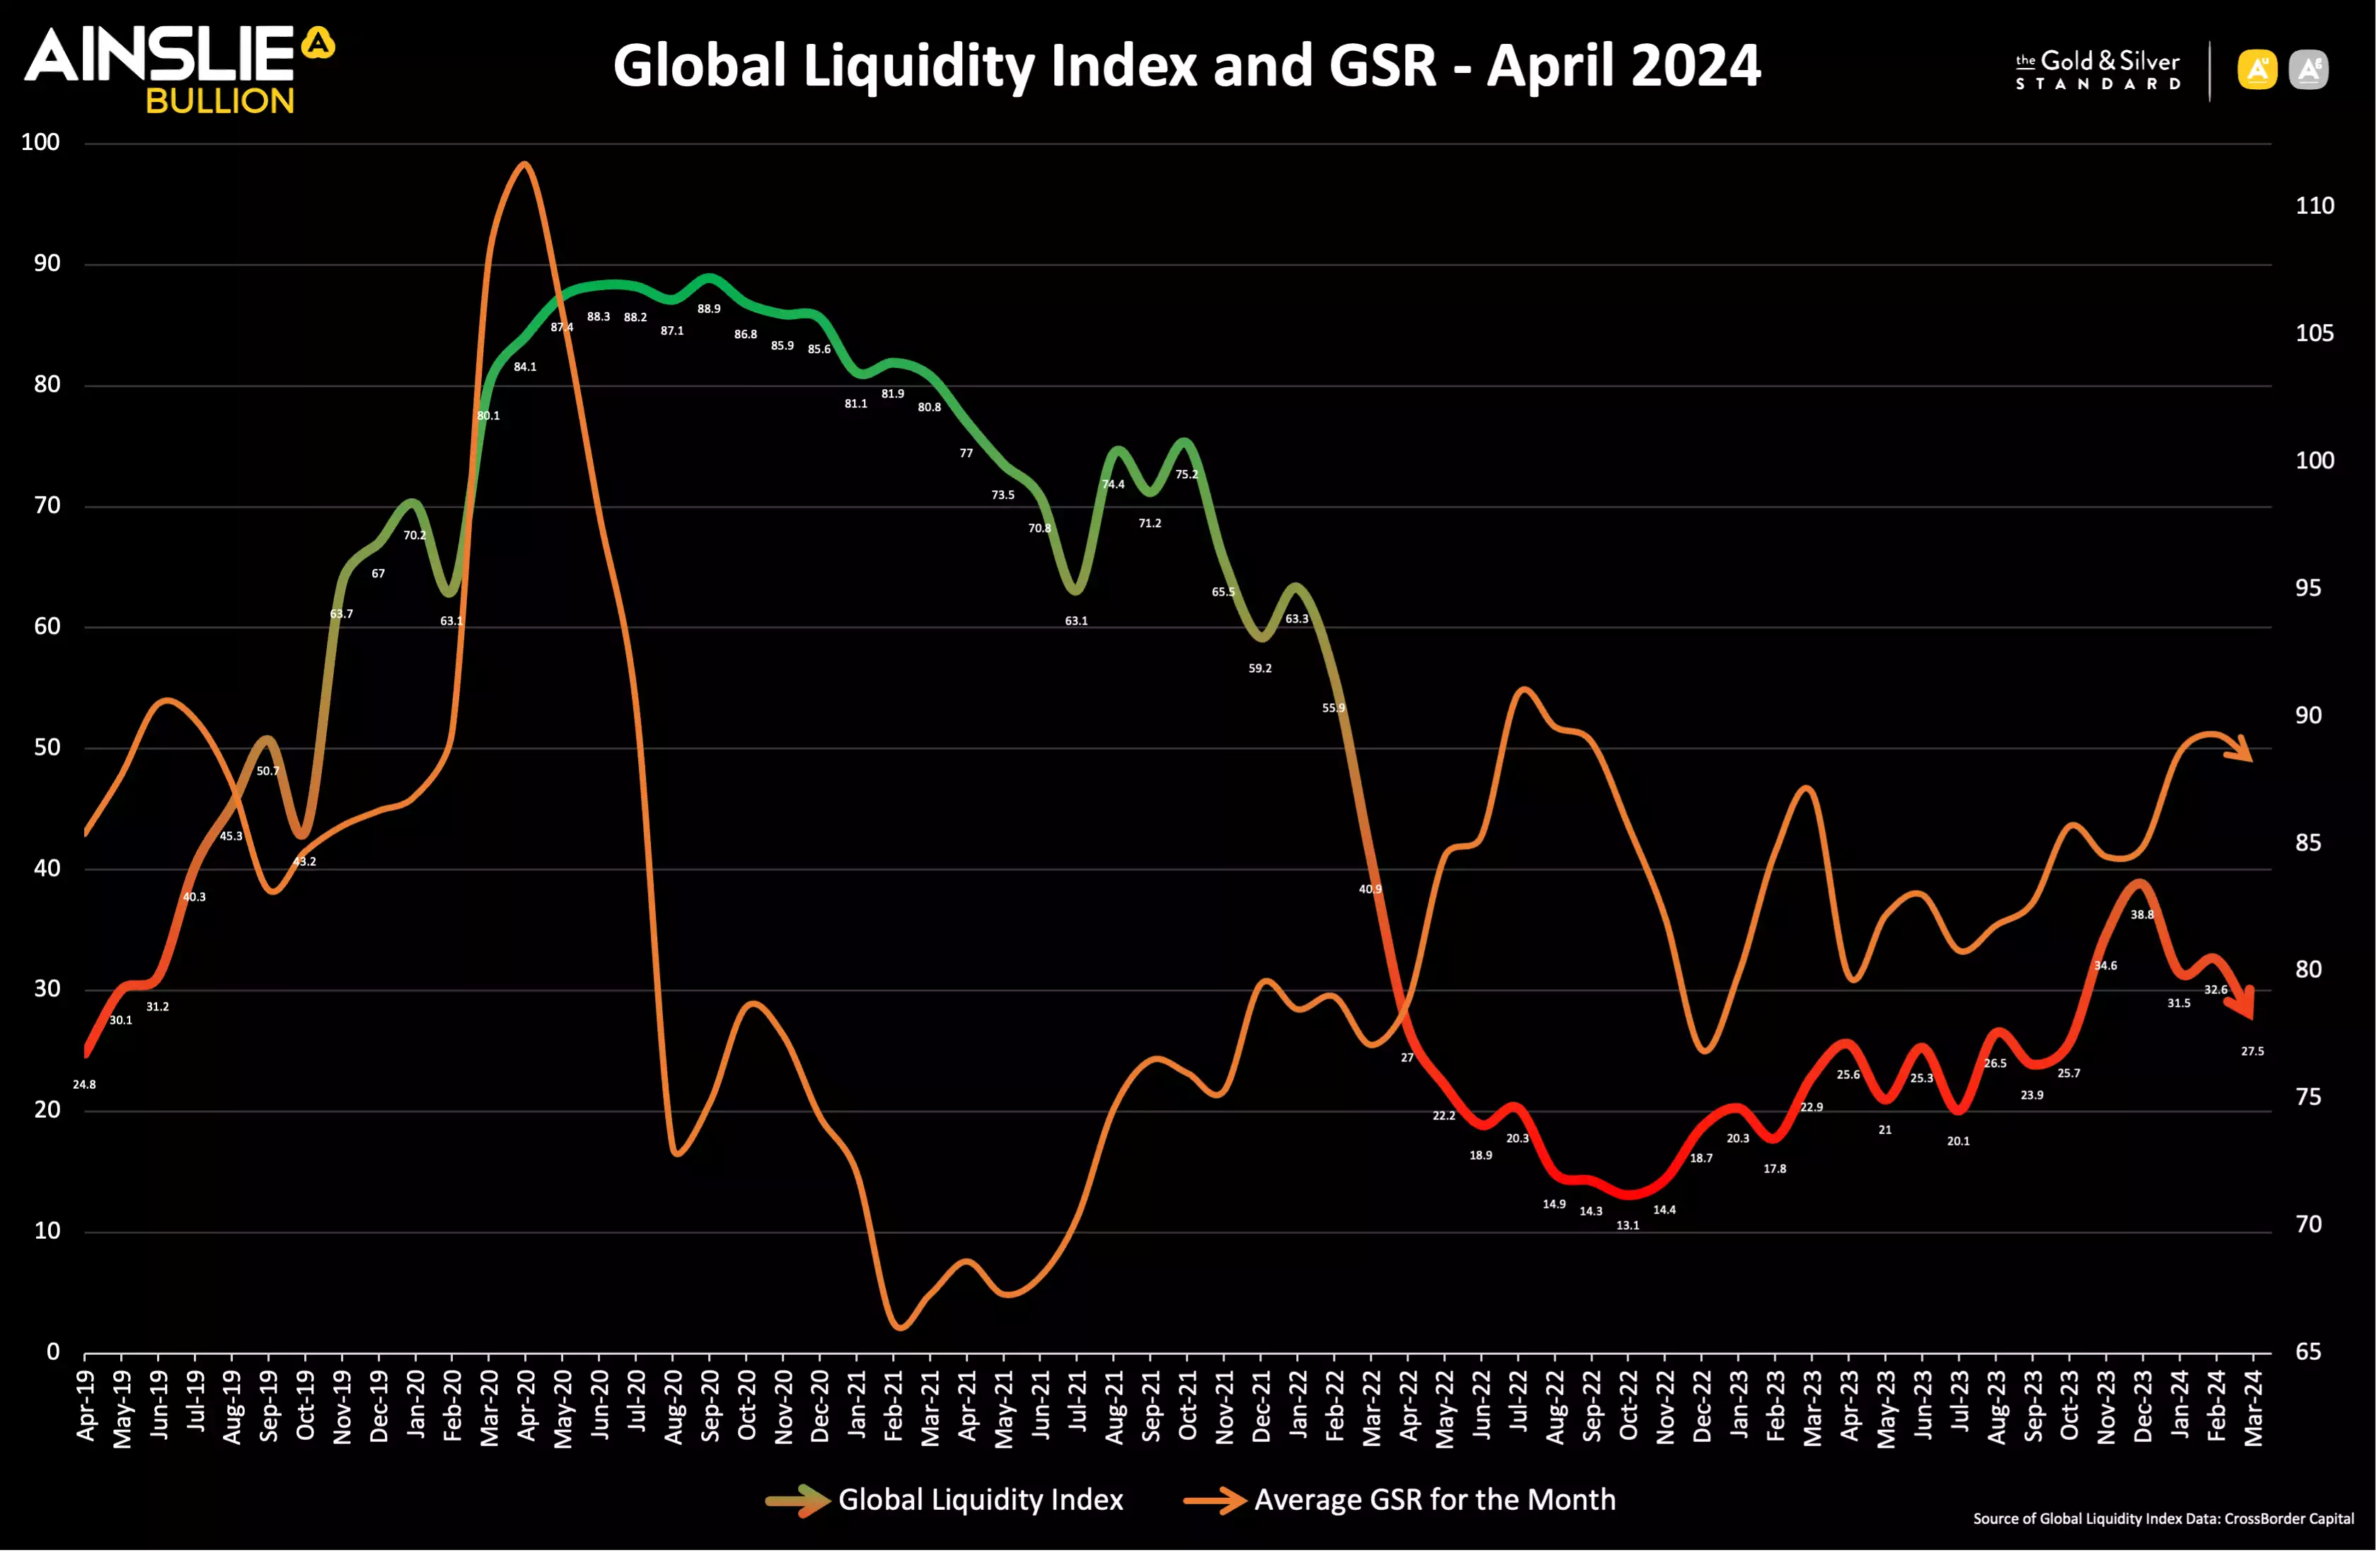
It remains prudent to key an eye on the Gold Silver Ratio (GSR), as when the ratio falls it can happen very suddenly, and the move in Silver can be explosive. The GSR is currently very high by longer term historical standards and trending upwards, despite a pause this month, so the potential for another Silver “slingshot” move higher, as the GSR mean reverts, continues to increase.
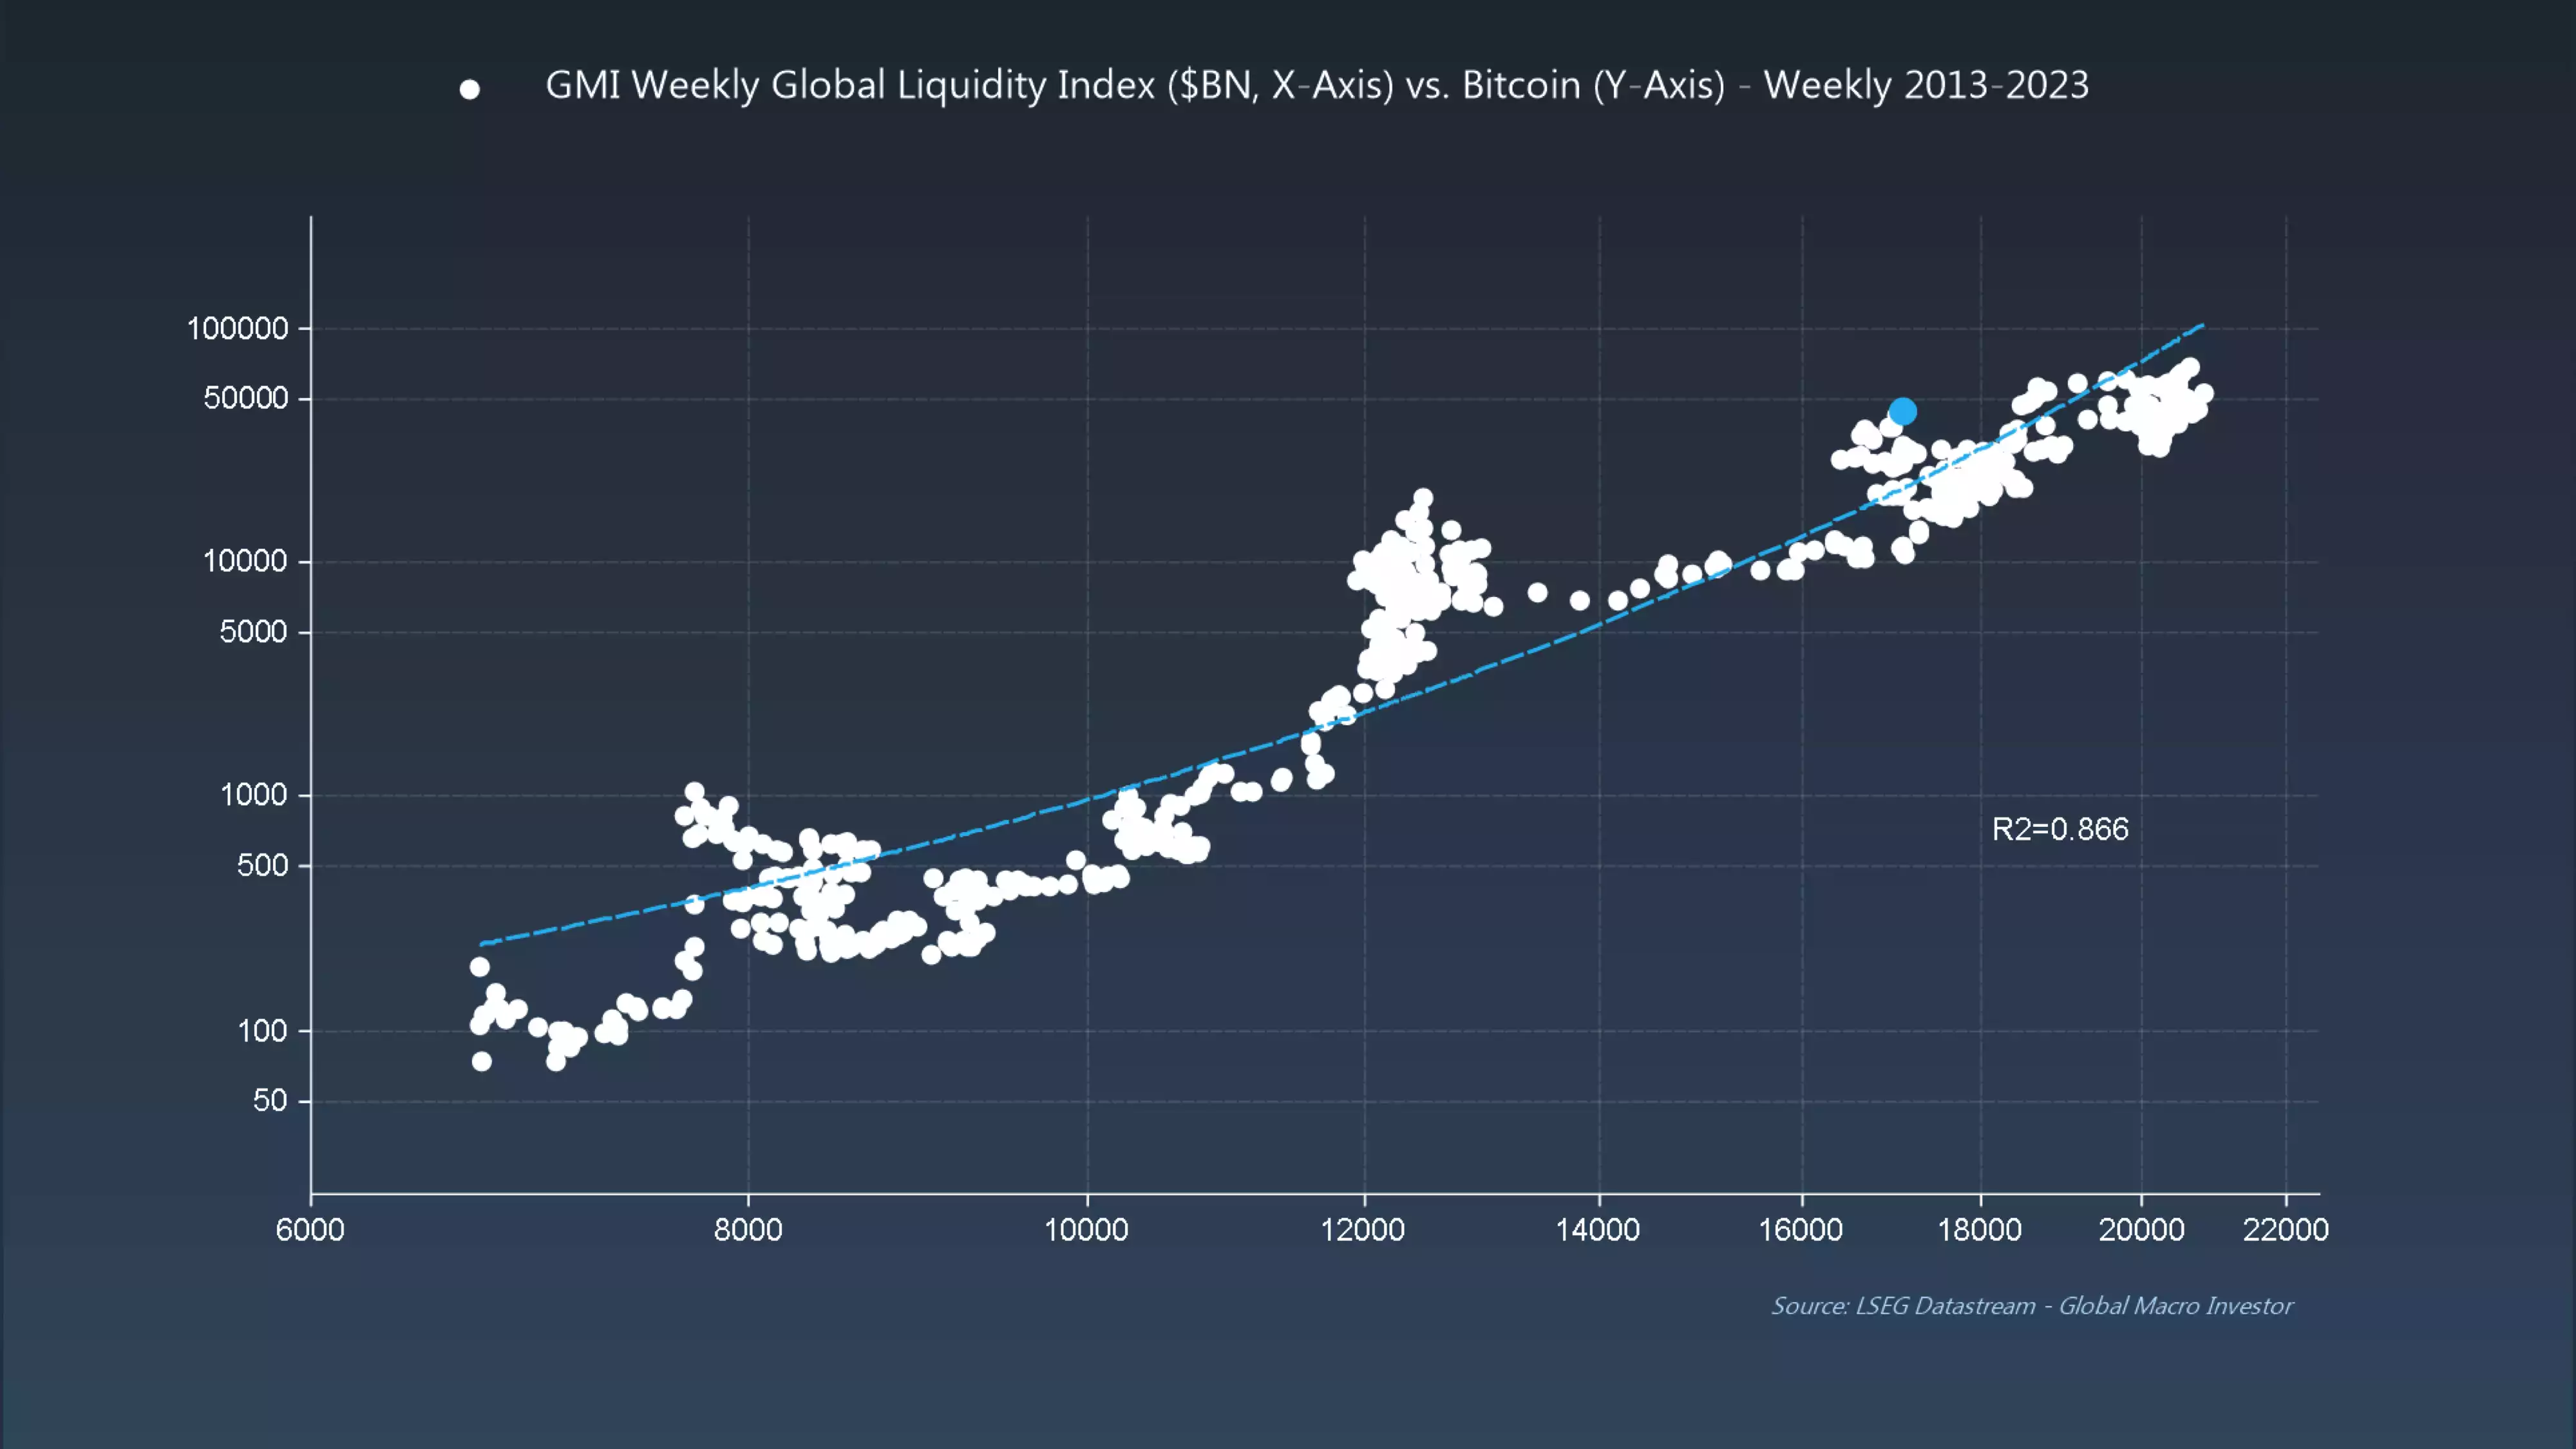
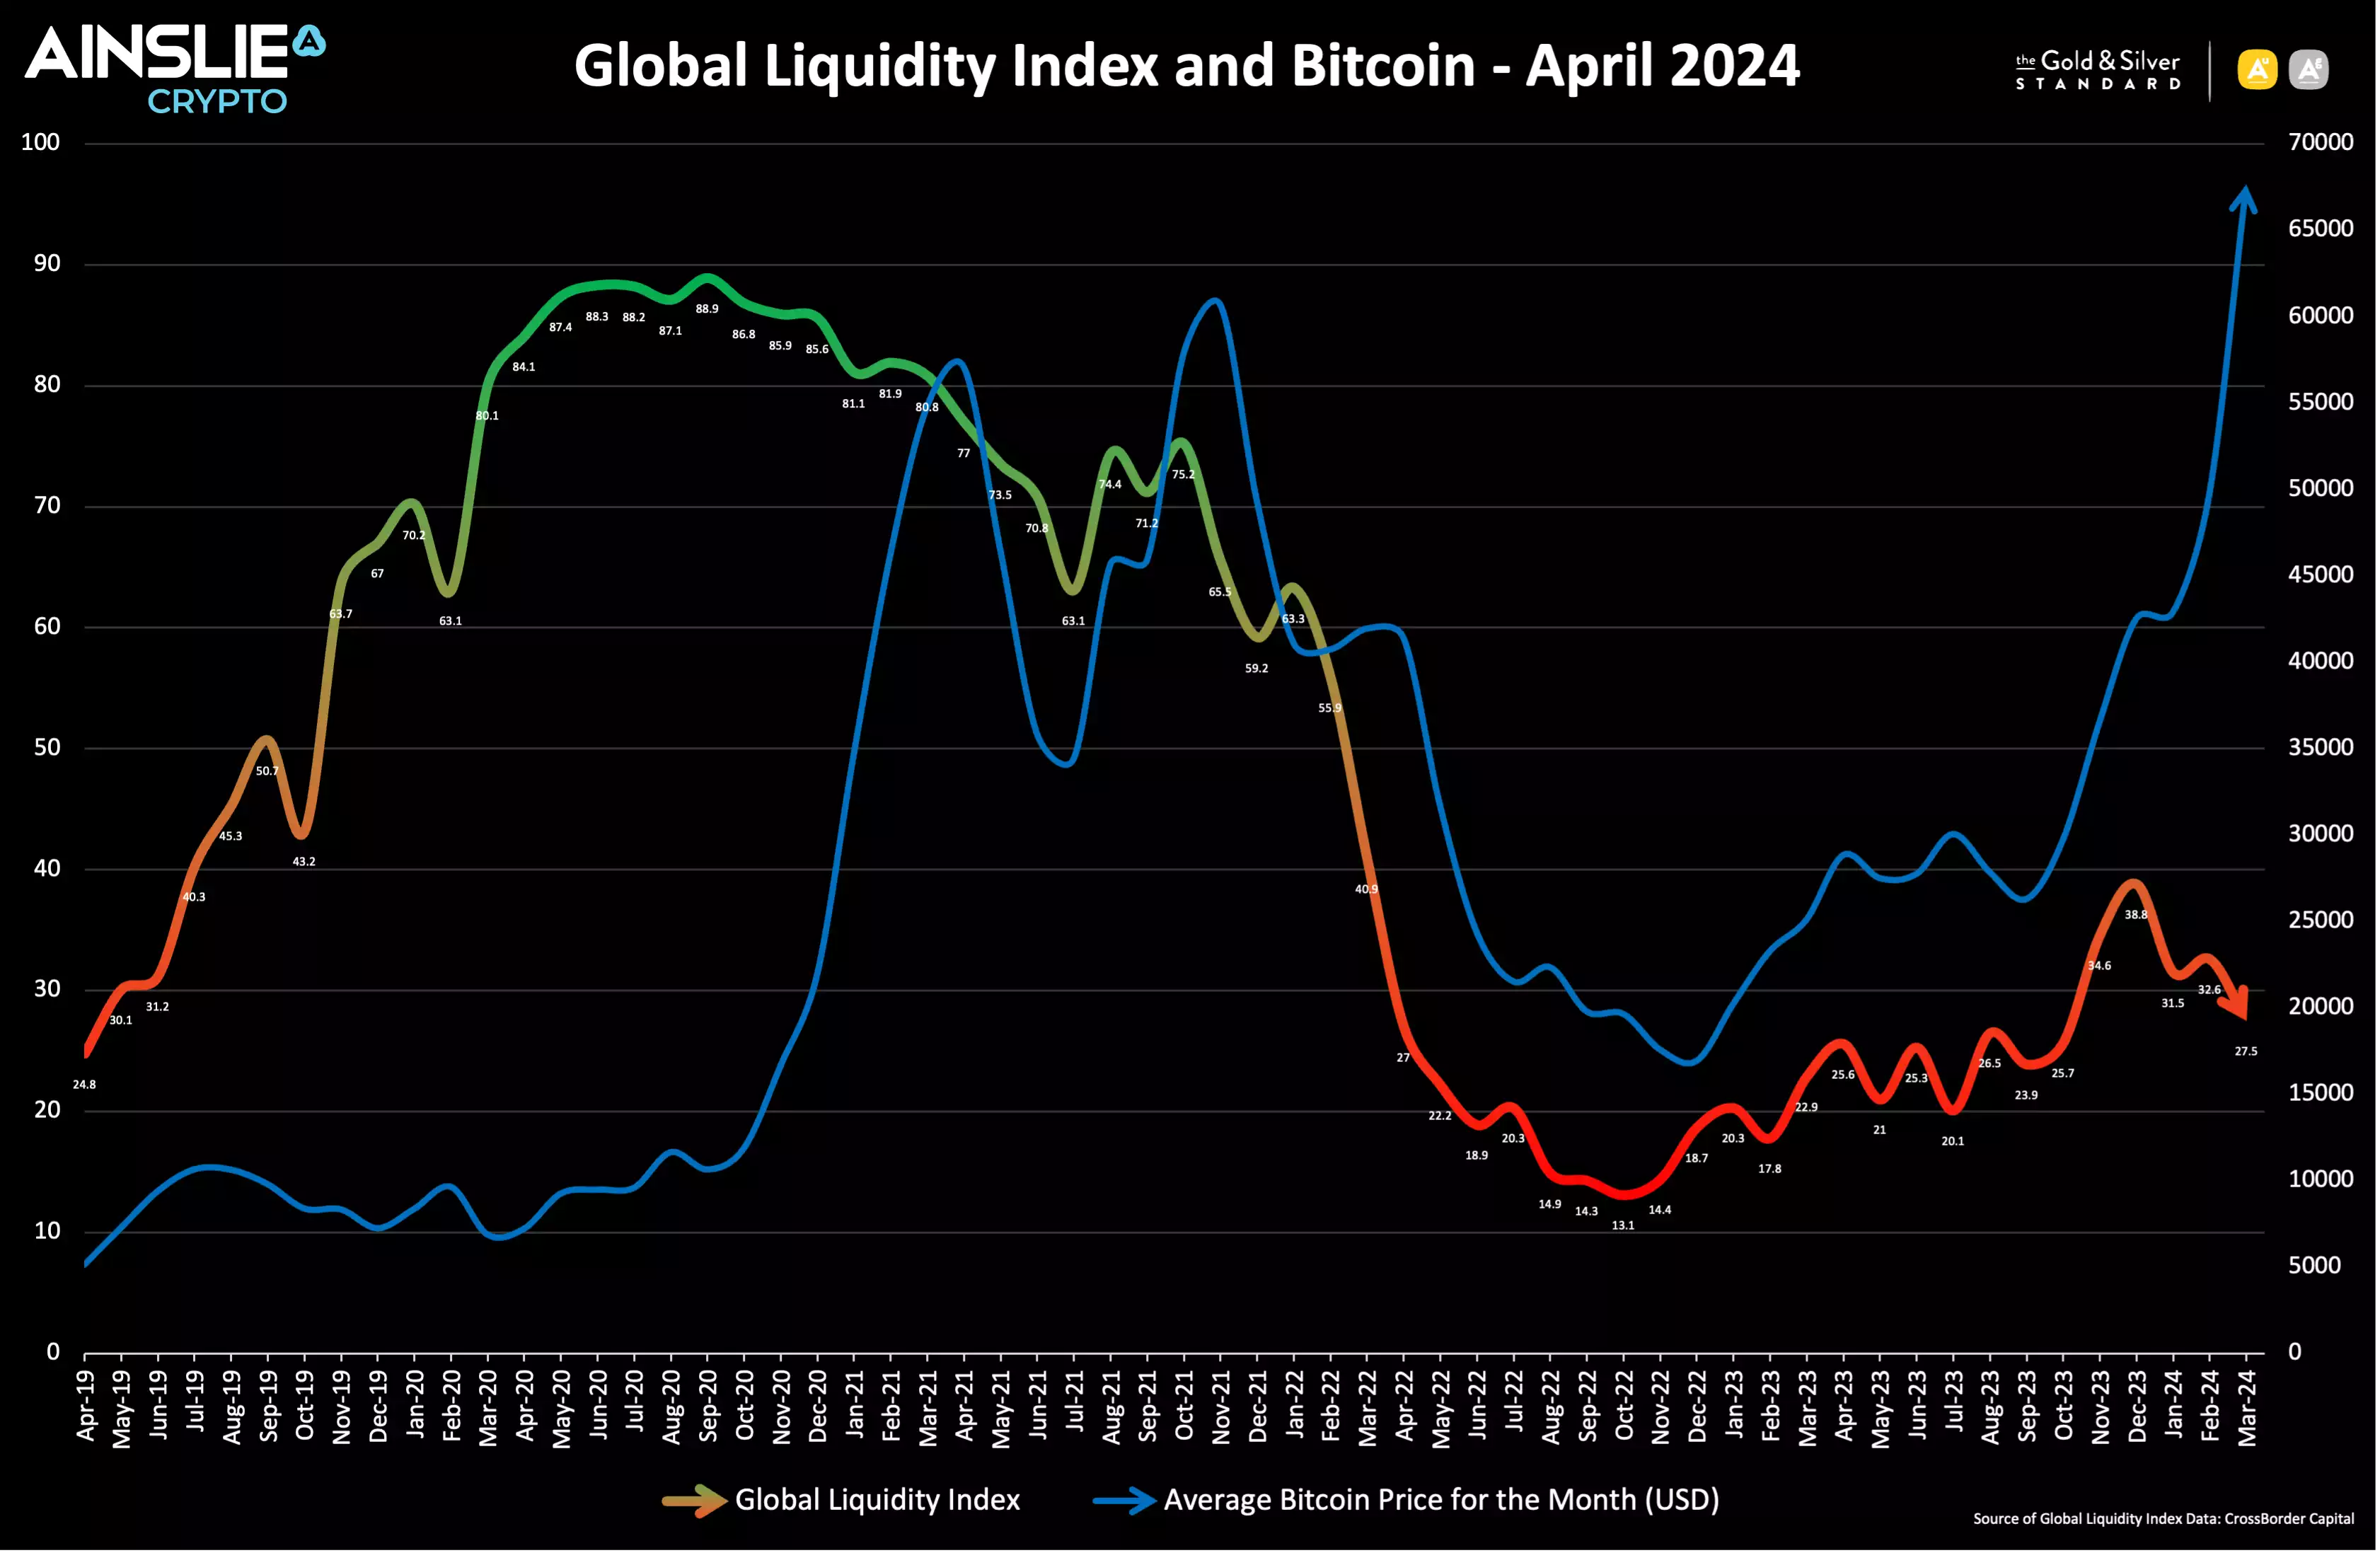
Bitcoin is the most directly correlated asset to Global Liquidity. Trading Bitcoin can be thought of as trading the Global Liquidity Cycle, but with an adoption curve that leads to significantly higher highs and lows each cycle.
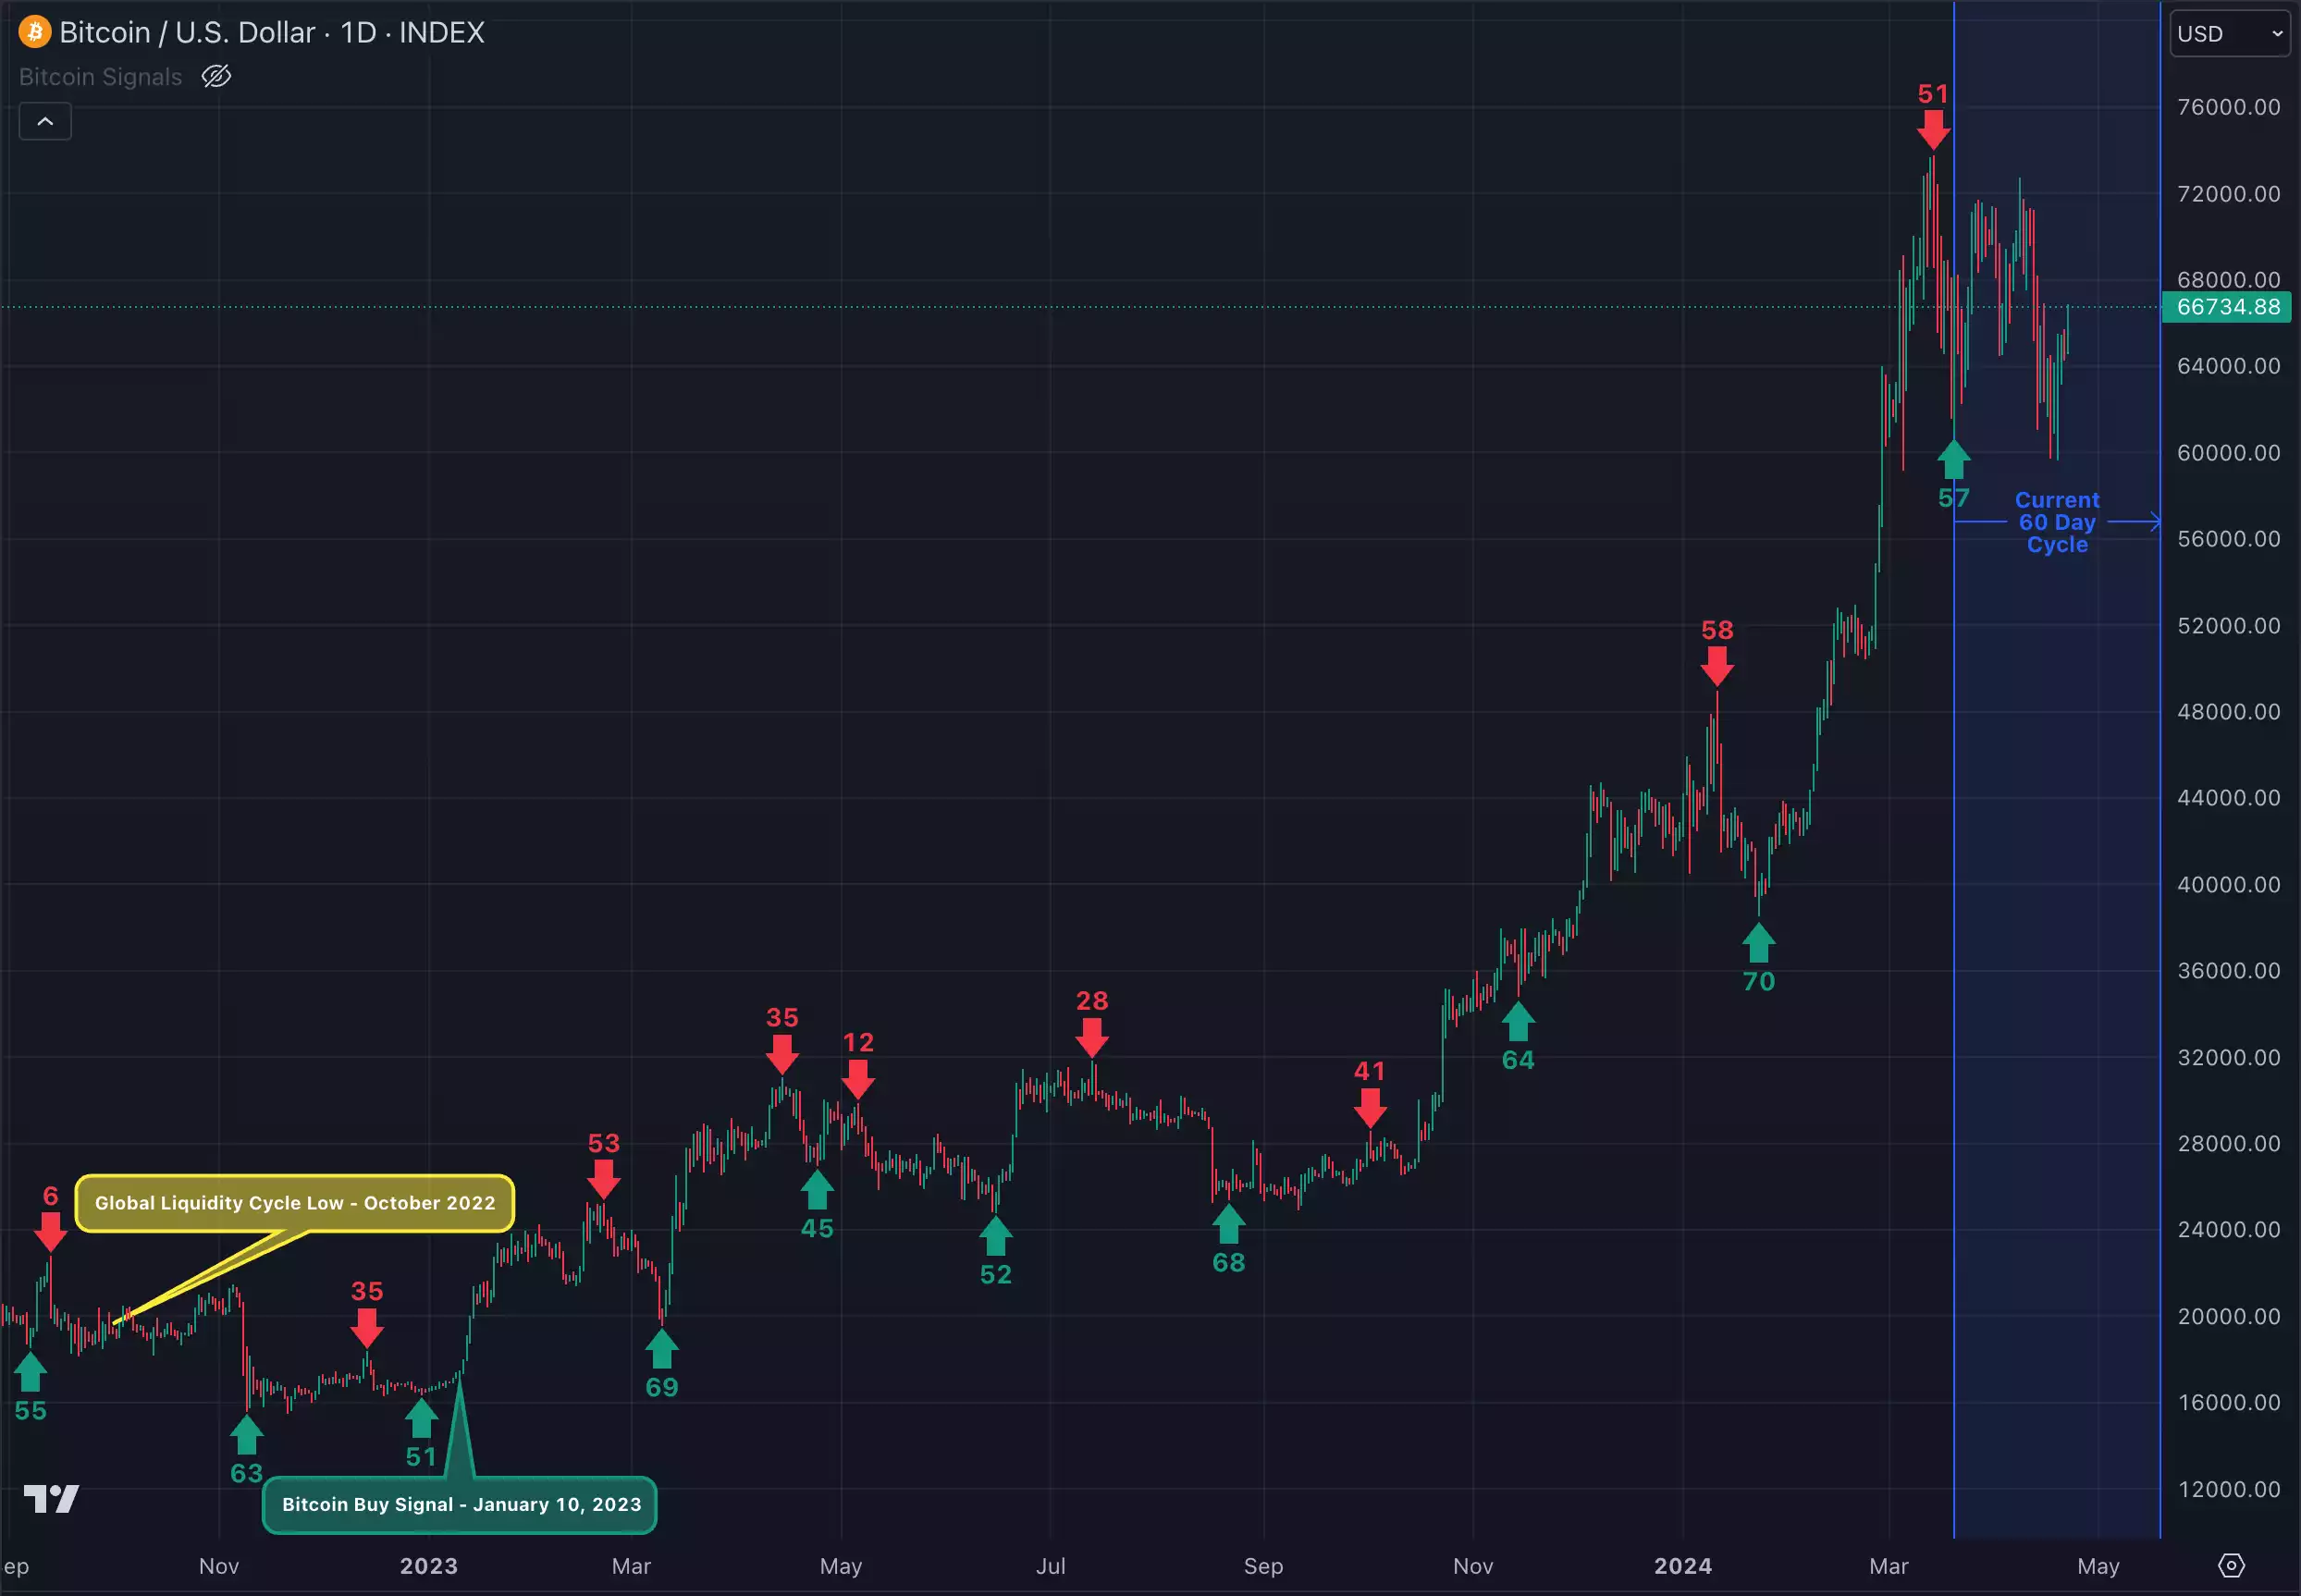
The Bitcoin cycle low was in November 2022, and since then the returns have been unmatched by any other major asset. Recently breaking through all-time highs and maintaining those gains with historically smaller than average drawdowns along the way suggests that the Bitcoin market is looking through the short-term Global Liquidity volatility noise to the much higher levels on the horizon.
A Simple Trading Plan to take advantage of the cycles
Watch the video presentation to see full details of the specific Trading Plan we provide, that you can follow, which has returned 225.1% p.a. as at Tuesday’s recording.
Watch the full presentation with detailed explanations and discussion on our YouTube Channel here: https://www.youtube.com/watch?v=yCVSxUSdGyc
Until next month when we return to reassess and identify what has changed, good luck in the market!
Chris Tipper
Chief Economist and Strategist
The Ainslie Group
x.com/TipperAnalytics
Note: The monthly video presentation is recorded live with our expert panel. Our objective is to make the updates as useful and specific to what you want to understand as possible, so as always feel free to reach out with any questions or feedback that we can incorporate into next month’s video to make it something that provides you with the highest possible value for your time!